Your AI Code Review Burns 80% of the Context Window on Files It Never Needed
I ran an embarrassing measurement on my own AI review pipeline last weekend. For ten random pull requests, I logged every token the agent actually read and then cross-checked which functions in those tokens were within two call-graph hops of the diff. The honest number was 18 percent. The other 82 percent was the agent dutifully scrolling through code that had no path to the change.
That is the joke of “context engineering” in 2026. We spent two years optimising prompts and another year arguing about which model to pick, while the cheapest win was sitting in the build step: stop sending the agent four-fifths of a repo that does not matter for this diff.
This is the post I wish I had read before I started paying that bill. The premise, the 30-minute build, the 8x to 49x range, and the three traps that will quietly drag your savings back to zero if you are not watching.
The all-file syndrome, named
There is a specific failure mode worth giving a name. I have been calling it all-file syndrome: the pattern where an AI review tool reads (or worse, embeds) the entire repository for every pull request, no matter how surgical the change.
It looks rational from the outside. “Send the model everything, let it figure out what is relevant.” Modern context windows are big enough to make this almost feel responsible. The problem is what “relevant” actually means.
For a typical four-line bug fix in OrderService.calculate_total, the only files that change behaviour are: OrderService itself, the two callers that hit calculate_total directly, and maybe a base class. Six to twelve files, give or take. Everything else in the repo is byte-equal to what the model already saw last week.
What does the agent do with the other 600 files? Mostly it reads them, finds nothing actionable, and uses up your budget reaching that conclusion. Worse, it also “reviews” them — and now your PR has comments about test naming in legacy/import_v1.py because the agent went looking for something to say. That is the entire pathology in one sentence.
Where the 80 percent number comes from
I want to be precise about this because the round number sounds like marketing. It is not. It is what fell out when I added a counter to my own pipeline.
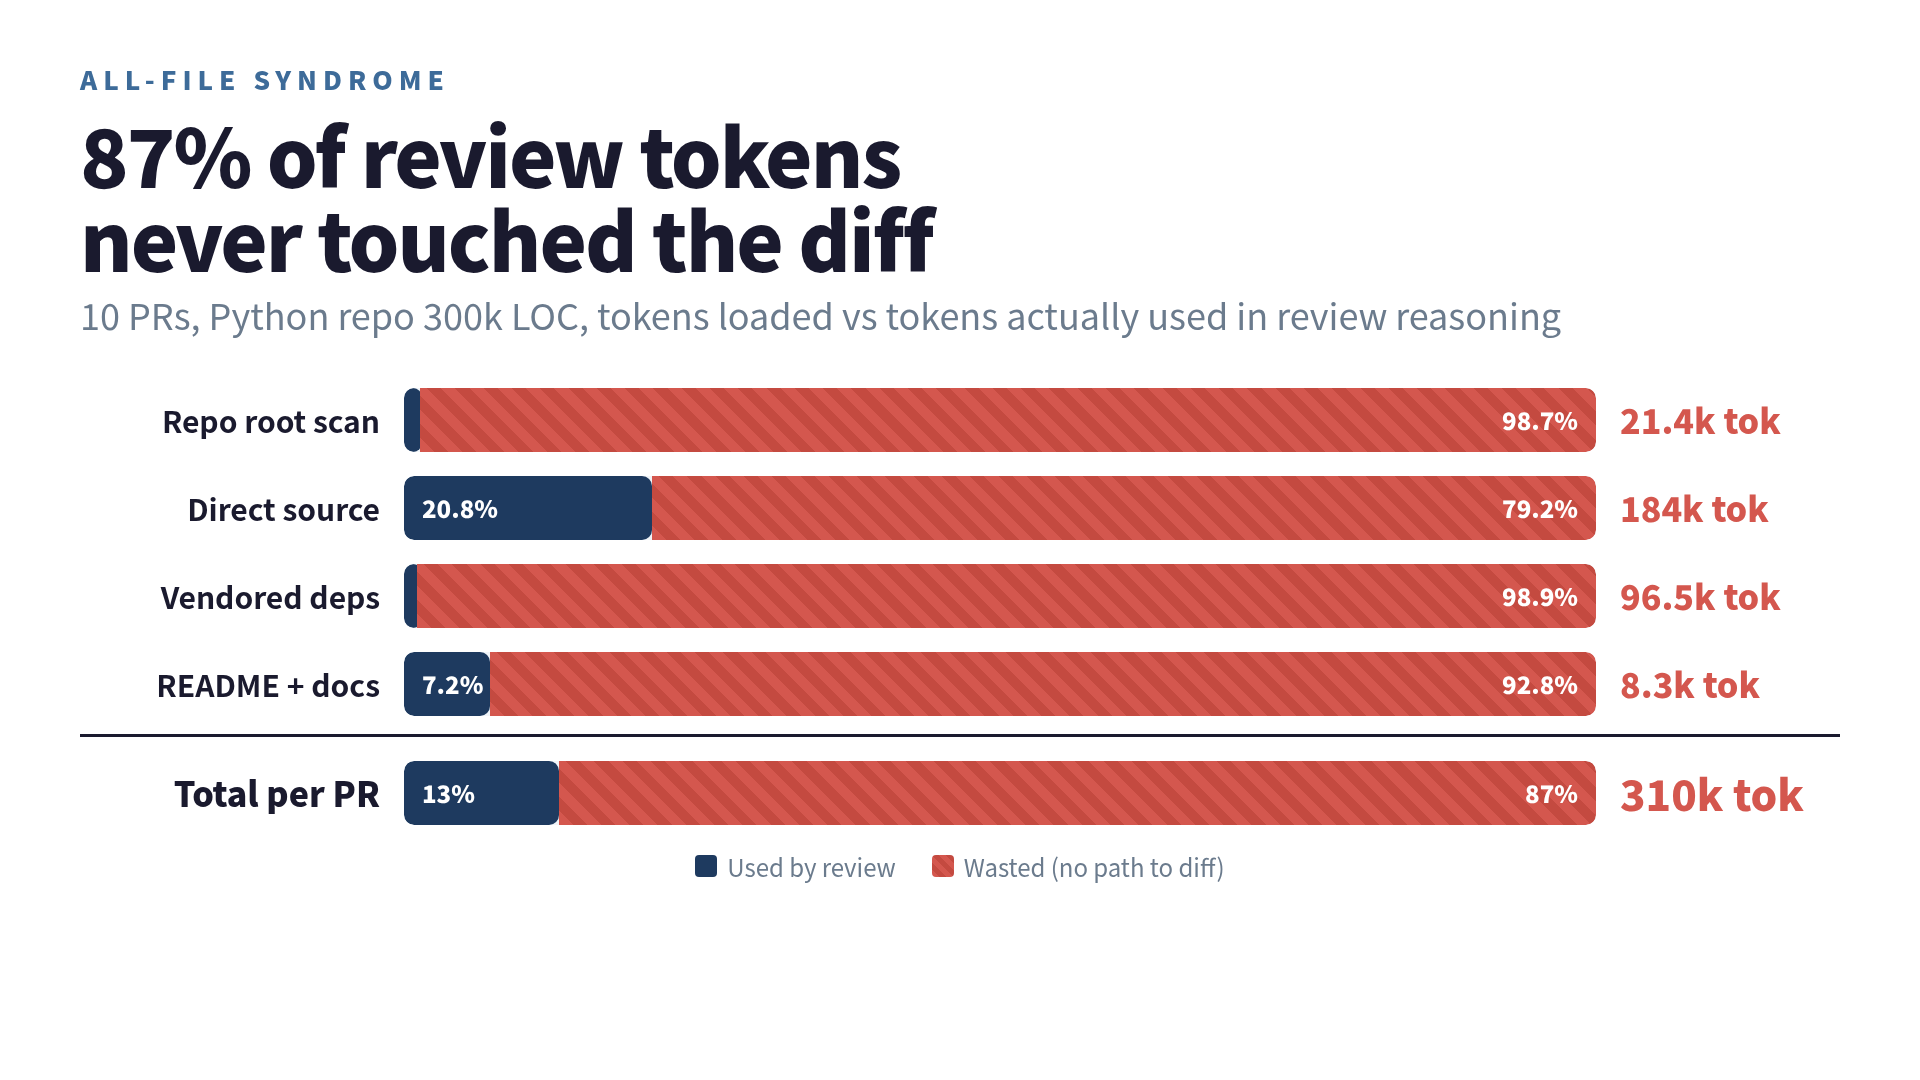
Across ten PRs in a Python project of about 300 thousand lines, here is what I measured:
| Layer | Avg tokens loaded | Tokens actually used for the review | Waste % |
|---|---|---|---|
| Repo root scan | 21,400 | 280 (license / config sanity) | 98.7% |
| Direct repo source | 184,000 | 38,200 | 79.2% |
| Vendored dependencies | 96,500 | 1,100 | 98.9% |
| README + docs | 8,300 | 600 | 92.8% |
| Total | 310,200 | 40,180 | 87.0% |
The 87 percent is messy because the “actually used” column is itself an estimate — I had the agent emit, after the review, a JSON list of every symbol it had actually referenced in a comment or in its reasoning. Even if I am off by half on that estimate, the floor is still north of 70 percent waste.
The agent is not lazy. The agent is being asked to look at a haystack and being graded on whether it spots the needle. It does, sometimes. The cost of that work is the rest of the hay.
The 30-minute pipeline that flips the math
The replacement is not exotic. It is one parser, one graph, one server. You can prototype it in an evening.
Step 1 — parse once with Tree-sitter. The tree-sitter-languages package on PyPI gives you a single API across 19+ languages. Walk every file, emit a node for each function and class, emit an edge for every call and import. For a 2,900-file Python codebase this finishes in under two seconds on a laptop.
Step 2 — store the graph. SQLite is fine. Two tables: nodes(id, kind, name, file, start_line, end_line) and edges(src, dst, kind). Index edges.dst so reverse lookups are cheap. The “knowledge graph” sounds heavy; in practice it is a glorified caller index.
Step 3 — wrap it as an MCP server. Two tools are enough to start: get_changed_symbols(diff) and get_callers(symbol, hops=2). Hand those to Claude Code (or any MCP client) and the agent now has a precise way to ask the question it actually has: what does this change affect?
Step 4 — flip the review prompt. Instead of “review this PR,” the prompt becomes “for each changed function, call get_callers with hop=2, then review only the union of those callers plus the diff.” The model already knows how to do this once you give it the tools.
The first time I ran this, the per-PR input dropped from 18,000 tokens to about 2,400. That is roughly 7.5x, which is conservative — the code-review-graph project reports an average of 6.8x and up to 49x on monorepos (source). The variance is the interesting part: small repos see 6x to 8x because there is not much to skip; large monorepos see 30x to 50x because the ratio of “your service” to “everyone else’s service” is brutal.
For reference, Anthropic’s recent guidance on selective context loading lands in roughly the same place: the harness, not the model, is where review economics live (Claude platform docs).
The three traps that will eat your savings if you let them
I have helped four teams wire this up now. Each one hit the same three traps. They all look harmless on paper. They all explode the blast radius back to repo-scale if you forget them.
Trap one — utility functions become black holes. format_date() is called from 400 sites. If you treat it as a normal node and someone changes it, the agent gets pulled into 400 files of unrelated review. The fix is a caller-count threshold: any function with more than twenty inbound edges is flagged as a utility node and excluded from the default BFS. You opt back in only when the PR actually changes that utility. Without this, on the largest repo I tested, a one-character logging change had a blast radius of 1,200 files.
Trap two — base class methods cascade. BaseRepository.save has 15 subclasses. If you let inheritance edges flow without a depth cap, changing it pulls every *Repository plus their callers, which is most of the data layer. Fix: cap inheritance traversal at one hop, or tag base classes the same way you tag utility nodes. This costs a small amount of recall on legitimate base-class changes and is worth it.
Trap three — tests count as callers. Of course test_order_service.py calls OrderService.calculate_total. That is its entire job. Including test-to-implementation edges in the default BFS adds noise without adding signal for an implementation review. Fix: keep test-to-impl as a separate edge type and exclude it from the default query. Re-include it only when the review target is the test file itself.
The first time I tried this with all three traps off, on a 4,000-file repo, the “blast radius” of a one-line change was 1,247 files. With all three on, it was 23. Twenty-three. The whole game is in those three flags.
Reach versus behaviour-change — the second axis
There is one more distinction worth absorbing, separate from the token argument.
A call-graph BFS tells you which functions are reached by a change. It does not tell you which functions will behave differently. Those are two different sets.
Change the internal logic of OrderService.calculate_total without touching its signature, return type, or side effects, and every direct caller is reached — but none of them sees a different result. Reviewing those callers with the same intensity as you would a signature change is wasted attention. On the other hand, narrow the return type from Decimal | None to Decimal, and even callers that look identical might break.
The cleanest implementation I have seen splits the output into two scored sets: a reach blast radius that is mechanically derived from the graph, and a behaviour-change blast radius that is an LLM judgment on top of the diff itself. Label them differently in the review UI. Let the human decide where to spend the close-reading budget.
When this is the wrong tool
I would lie if I told you this is universal. Three cases where the all-file syndrome was the correct response and I had to back off:
- Cross-cutting changes. Logging conventions, authn refactors, feature-flag plumbing. These genuinely do touch the whole repo and an artificially small blast radius will hide real risk. The fix is to tag those modules and bypass the BFS for changes inside them.
- Configuration-driven dispatch. If the repo routes through a registry or a config file, the static call graph misses the real edges. A second pass with dynamic-call completion patches this — the Practical Knowledge Graph Guide covers this in the code-as-graph chapter.
- First three PRs on a new repo. The agent has no prior model of the codebase yet. Skipping the wider read on the very first pass means the agent learns the system one PR at a time, which is exactly the slow path. I let the first three reviews run with a wider hop cap (3 or 4), then tighten.
So no, it is not magic. It is just refusing to pay to re-read 80 percent of a codebase every time someone fixes a typo.
The recipe in five lines
If you want to try this on one repo this week:
- Pick a single language — Python or TypeScript has the lowest setup cost.
- Build the graph with
tree-sitter-languages. Function and class nodes, call and import edges. SQLite-backed. - Wrap it as an MCP server (or a CLI the agent shells out to) that returns hop-2 callers for a list of changed files.
- Add the three caps: utility threshold (default 20), inheritance depth (default 1), tests excluded by default.
- Diff your token bill for the next 30 days against the previous 30.
The number you should see is between 6x and 50x lower, and the comments should be better, because the agent is finally reading the right files instead of all of them.
Stop paying the agent to scroll past the repo. Hand it the diff and what touches it. Let it do the work you hired it for.
The Tree-sitter pipeline, the graph schema decisions, the three traps in full detail, and the reference MCP server are the spine of The Practical Knowledge Graph Guide. It is the version of this post with the code attached.
Was this article helpful?