Bing Webmaster Tools vs Google: 787 queries
Google will not tell you how many times a keyword was searched unless you are paying for ads. Bing will, for free, as an integer, going back 24 months. Most people I talk to do not know this.
So the free stack for keyword demand looks lopsided. One search engine hands you numbers. The other hands you a range that spans an order of magnitude. This post is about what you can actually do with that, and where I found the limits by measuring 787 real queries from two sites I run.
Short version: Bing gives you counts but goes blind on non-English compound queries. Google gives you no counts at all, but its suggest endpoint can tell you whether a phrase gets typed. That second signal is weaker than I hoped, and I have the numbers to say how much weaker.
Google Keyword Planner rounds you off
If your Google Ads account has no active spend, Keyword Planner returns volume as a bucket: 10, 100, 1K–10K, 10K–100K, and so on (Google Ads Help). The buckets are logarithmic and they are built for advertisers, so the tool is behaving as designed. It just is not designed for you.
Landing in the 1K–10K bucket means you cannot separate 1,200 from 9,000. When you are deciding whether a topic is worth an article, a number with a 7x spread inside it is not a number.
Google Trends is an index, not a count. It scales the peak to 100, so you can compare two terms against each other but you cannot ask how often either one gets typed.
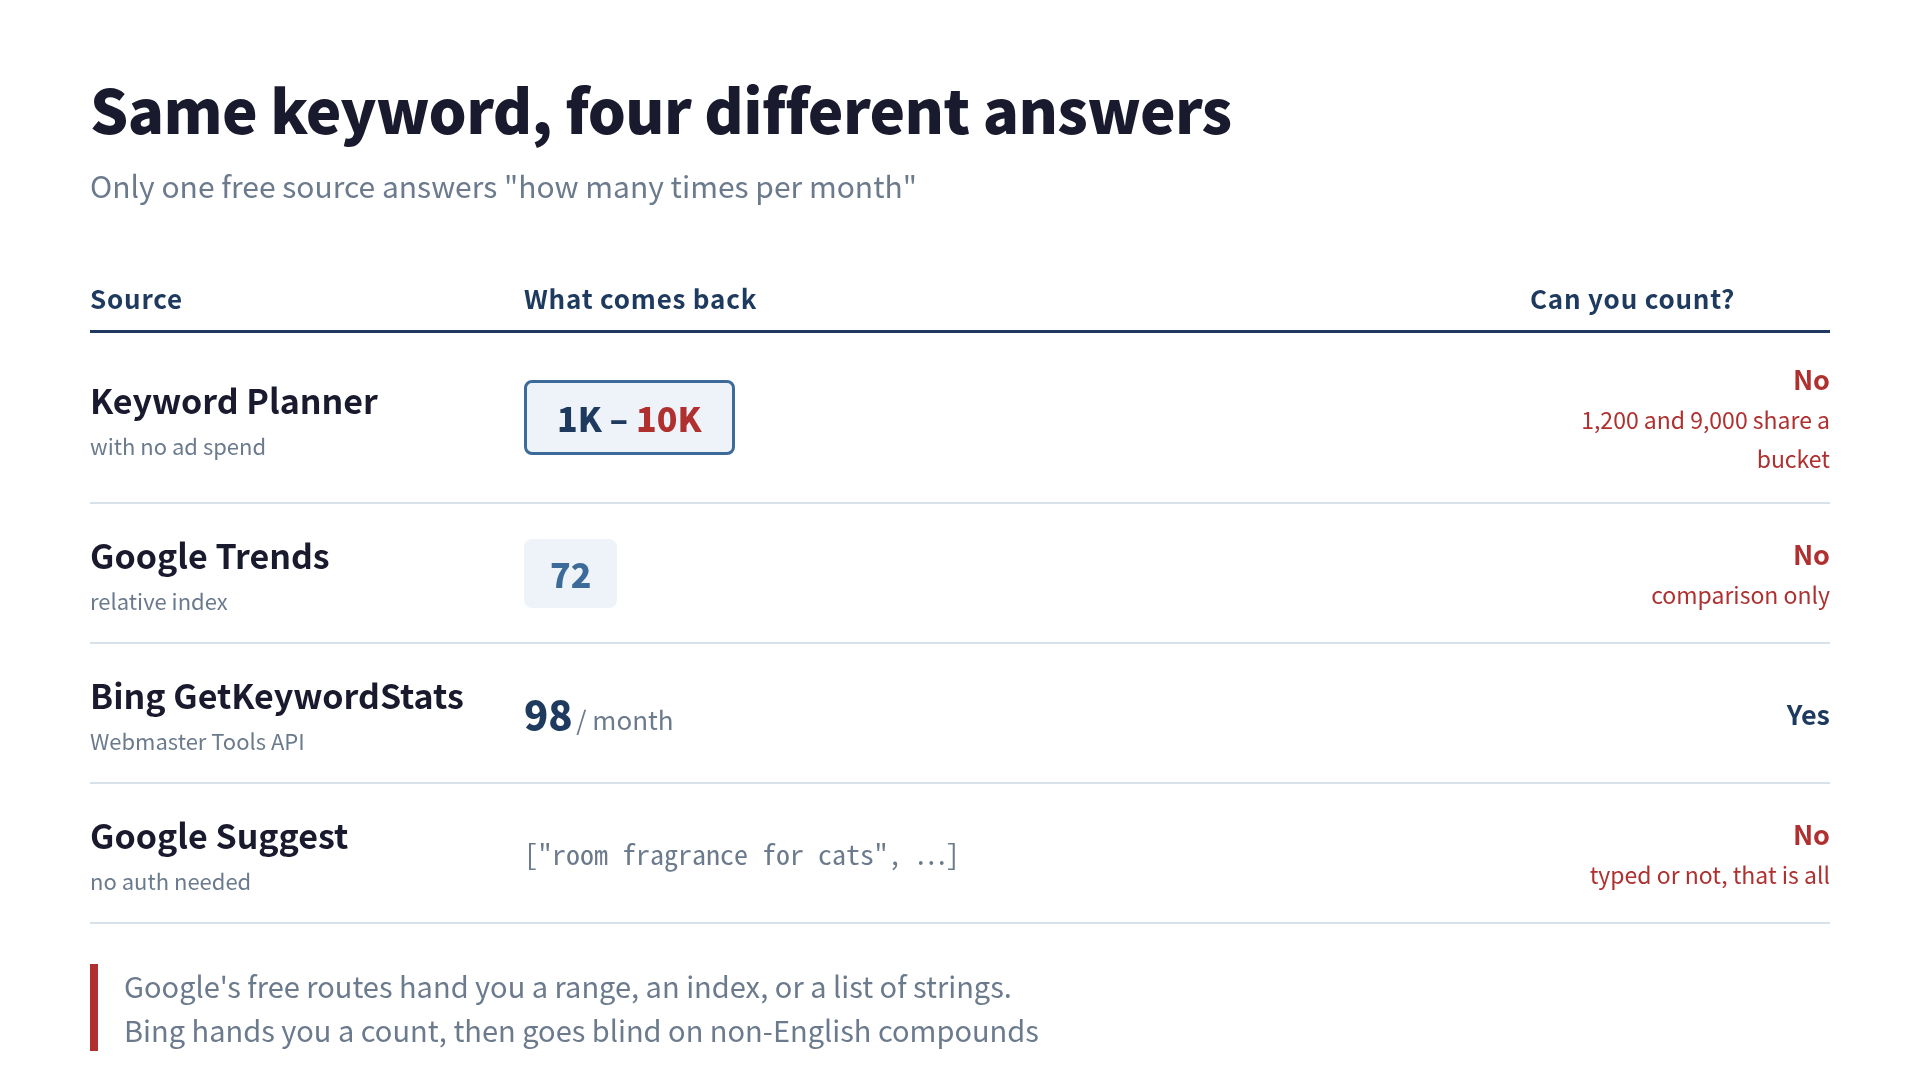
The rest of this post is about the bottom two rows.
Bing Webmaster Tools returns real monthly counts, for free
The Bing Webmaster Tools API has a GetKeywordStats endpoint. Register a site, get an API key, and you can pull monthly impression counts as integers.
import requests

url = "https://ssl.bing.com/webmaster/api.svc/json/GetKeywordStats"
r = requests.get(url, params={
    "apikey": API_KEY,
    "q": "room fragrance",
    "country": "us",
    "language": "en-US",
})
# [{"Query": "room fragrance", "Impressions": 79, "Date": "/Date(...)/"}, ...]
You get one row per month, up to 24 months back. Bing’s absolute numbers are not Google’s, and in markets where Google holds most of the share you should not read them as market volume. But for comparing terms against each other, and for seeing seasonality, 24 months of integers beats a logarithmic bucket every time.
I wrapped this in a script that grades terms on observed months and broad-match volume:
verdict     exact/mo     broad/mo   months  keyword
   OK            79           98       24   room fragrance
That worked well enough that I started using it to pick article topics. Then I checked it against terms I already knew were real.
Where Bing goes blind
I ran the same tool against queries that were already sending me traffic:
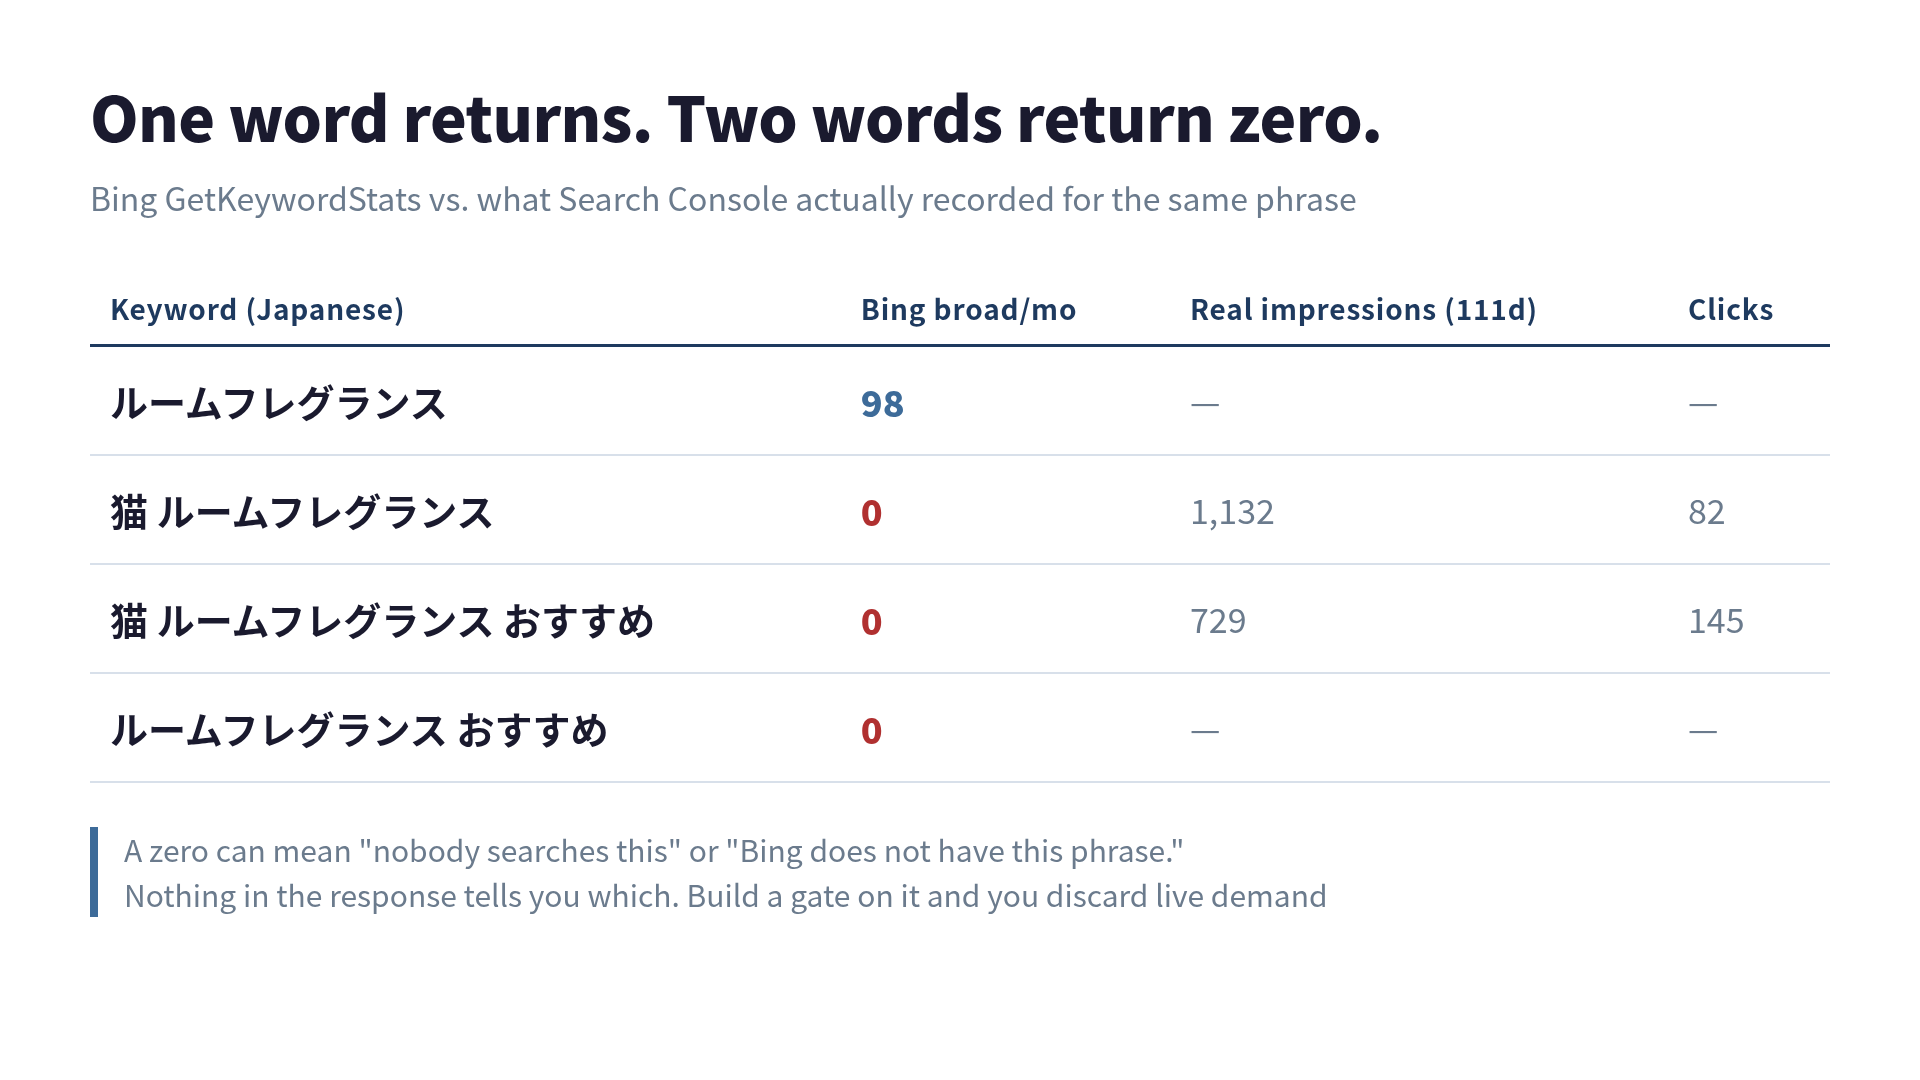
The one-word term comes back. Add a second word and it returns zero, even though Search Console shows that exact phrase pulling 1,132 impressions and 82 clicks over 111 days. The three-word version is the single biggest click driver on that site, and Bing has never heard of it.
These are Japanese queries. English behaves better in my experience, and three-word English phrases often return non-zero. But the failure mode is what matters here, not the language: a zero from this API can mean “nobody searches this” or it can mean “Bing does not have this phrase in its keyword database.” Nothing in the response distinguishes the two.
If you build a gate on that zero, you throw away terms people are actively typing.
Google Suggest tells you whether a phrase gets typed
Google’s autocomplete is an endpoint you can call without a key or an account.
import urllib.request, urllib.parse, json

def suggest(q, hl="en", gl="us"):
    url = "https://suggestqueries.google.com/complete/search?" + urllib.parse.urlencode(
        {"q": q, "client": "firefox", "hl": hl, "gl": gl})
    req = urllib.request.Request(url, headers={"User-Agent": "Mozilla/5.0"})
    return json.loads(urllib.request.urlopen(req, timeout=20).read().decode("utf-8"))[1]
What comes back is an array of candidate strings. No counts anywhere. You cannot learn how often anything is typed.
There is exactly one thing you can read from it. Whether your input string appears in its own suggestion list. Call it an echo.
>>> suggest("room fragrance for cats")
['room fragrance for cats', 'room fragrance for cats safe', ...]
#  ^^^^^^^^^^^^^^^^^^^^^^ the input came back
Suggestions are built from real query logs, so a phrase nobody types does not show up as a candidate. That direction holds: an echo means the phrase gets typed.
The question is the other direction. If there is no echo, does that prove there is no demand?
A note before the numbers, because this endpoint is undocumented. Rate limits and response shapes can change without warning. I spaced calls 1.3 to 2.0 seconds apart with jitter and retried up to three times with backoff, and got zero failures across 787 calls, which is a property of the spacing rather than the endpoint. More importantly, never let a 429 or an HTML error page collapse into “no candidates.” Failing to fetch and finding no demand are different facts. I recorded success, malformed-shape, and transport-failure as separate statuses and excluded anything abnormal from the counts. Merge those and the moment Google throttles you, every keyword you own turns into “no demand.”
Measuring it against 787 real queries
My first attempt at validating this was circular, and it is worth describing because the mistake is easy to make.
I wanted to test the claim “no echo means no demand.” To test it I needed a list of phrases that genuinely had no demand. So I collected phrases where I had published an article and gotten zero impressions.
Zero impressions has many causes. Not indexed. Ranked outside the visible range. Intent mismatch between the query and the page. Dropped by Search Console’s own aggregation. Every one of those produces the same zero.
I was assuming my conclusion while building the data I planned to test it with. Measure anything that way and you get your assumption back.
The fix was to change what I measure. “No echo means no demand” is not provable, because a ground-truth list of never-typed phrases does not exist. But there is something adjacent that is measurable: of the phrases known to be real, what fraction does this rule reject? That is the false negative rate, and for a rejection gate it is the number that matters. Discarding a viable topic forever is a worse outcome than writing one article you did not need.
False negative rate only needs positives, so the impossible negative list is no longer required.
Search Console queries are proof of typing that is independent of how good the article is. Somebody entered that string. That makes them clean positives.
| Site | Population | Measured | Sampling |
|---|---|---|---|
| mypcrig.com | 1,197 unique queries / 111 days | 475 | stratified |
| kaoriq.com | 312 unique queries / 111 days | 312 | full census |
Three rules, from strict to loose:
- R1: reject unless an exact-match candidate appears
- R3: accept if any candidate contains all the input words (tolerates word order and suffixes)
- R4: reject only when there is no echo and zero candidates come back
Results
| Rule | mypcrig | kaoriq |
|---|---|---|
| R1 exact match | 7.1% (95% CI 4.2–10.0) | 9.3% (6.5–13.0) |
| R3 all words present | 5.5% (3.0–8.0) | 8.3% (5.8–11.9) |
| R4 zero candidates only | 3.9% (1.7–6.1) | 8.0% (5.5–11.6) |
Those are false negative rates: the share of confirmed-real queries the rule wrongly rejects. Between one in twenty and one in twelve.
One result came out clean. On mypcrig, R3 rejected none of the 168 queries that had produced clicks. What gets dropped skews structurally toward phrases with impressions but no clicks. That is a full census though, so it says “zero out of 168 on this site over these 111 days” and nothing about other sites or future queries.
What actually gets dropped
The composition matters more than the rate.
Branded queries always fail. My own site name, kaoriq, pulled 171 impressions and 27 clicks and returns no echo. Of course it does not autocomplete: nobody outside my traffic knows the word. People are searching for me by name and the rule reports no demand.
Question-shaped queries fail. macbookはファンレスですか、それともアクティブ冷却がありますか? (“is the MacBook fanless or actively cooled?”) pulled 117 impressions. Nobody types full sentences into a search box, so autocomplete has never seen it. This is almost certainly AI-search traffic, and it is the shape that is growing.
Formatting variants fail. tok s, token sec, and token per sec are all people reaching for tok/s. Same intent, different strings, no echo. Normalize before you query and you recover some of these. I had not written a normalizer, so they dropped.
And some real losses. Three queries about PC case airflow all returned zero candidates, together worth 164 impressions, one of them appearing on 67 separate days. They are also the same topic. Counted as queries that is 3 of 787. Counted as topics it is one subject lost entirely, which is the number that should worry you.
The language parameter is worth 1.6x
kaoriq’s 8.3% had a cause I did not predict. Splitting by query language:
| Population | False negative rate | |
|---|---|---|
| Japanese queries | 181 | 6.6% |
| English queries | 131 | 10.7% |
kaoriq is multilingual and carries English articles, and I was querying all of them with hl=ja&gl=jp. Measured on Japanese alone it is 6.6%, close to mypcrig’s 5.5%. The single largest miss in the entire dataset, bedroom scents for sleep at 1,354 impressions across 44 days, was an English query I asked Google about in Japanese.
If you implement this on a multilingual site, match hl and gl to the language of each query. Skip that and you inflate your false negatives by more than half.
Three ways I got the measurement wrong
Same order you will hit them.
Zero failures is not evidence when the sample is small.
My first run was 14 queries with zero false negatives. Zero looks perfect. But the rule of three says that with 0 failures in n trials, the 95% upper bound on the failure rate is roughly 3/n. At n=14 that is about 20%. In one stratum of 6, it was 50%. Zero proves nothing until n is large.
If you sampled strata at different rates, you cannot just add them up.
mypcrig has 1,197 queries. Rather than call all of them I grouped by property and sampled each group differently:
- 168 queries with clicks → measured all of them
- 233 queries without clicks → measured 100 of them
Then I computed “rejected ÷ measured.” That is wrong. One query from the group where I measured 100, and one from the group where I measured all 168, were counted at the same weight. The first group really contains 233, so 10 rejections out of 100 means about 23 across the group, and the 133 I never called had vanished from the arithmetic. Reweighting moved 4.5% to 5.5%, which is to say I had been erring toward “safer than it is.”
Nearly 30% off.
My grouping did not cover the population either.
“Has clicks,” “appeared 10+ days,” and “appeared under 5 days” sum to 510. The population is 1,197. 689 queries, well over half, belonged to no group at all. They were everything that appeared on 5 to 9 days without clicks. Add up your strata and check the total against the population before you compute anything.
Do not reclassify the failures after the fact.
Looking at rejected queries, some are obvious junk: search operators, fragments of prompts to an AI, strings that mean nothing. Sort those into “correctly rejected” and the rate falls from 5.6% to 2.4%.
That reclassification happens after seeing the results, and I had not built a normalizer or a classifier, so in the actual pipeline those queries drop like any other. Report the number your pre-registered mechanical rule produces. The hand-sorted version is an appendix.
Verdict: not a rejection gate, fine as a priority signal
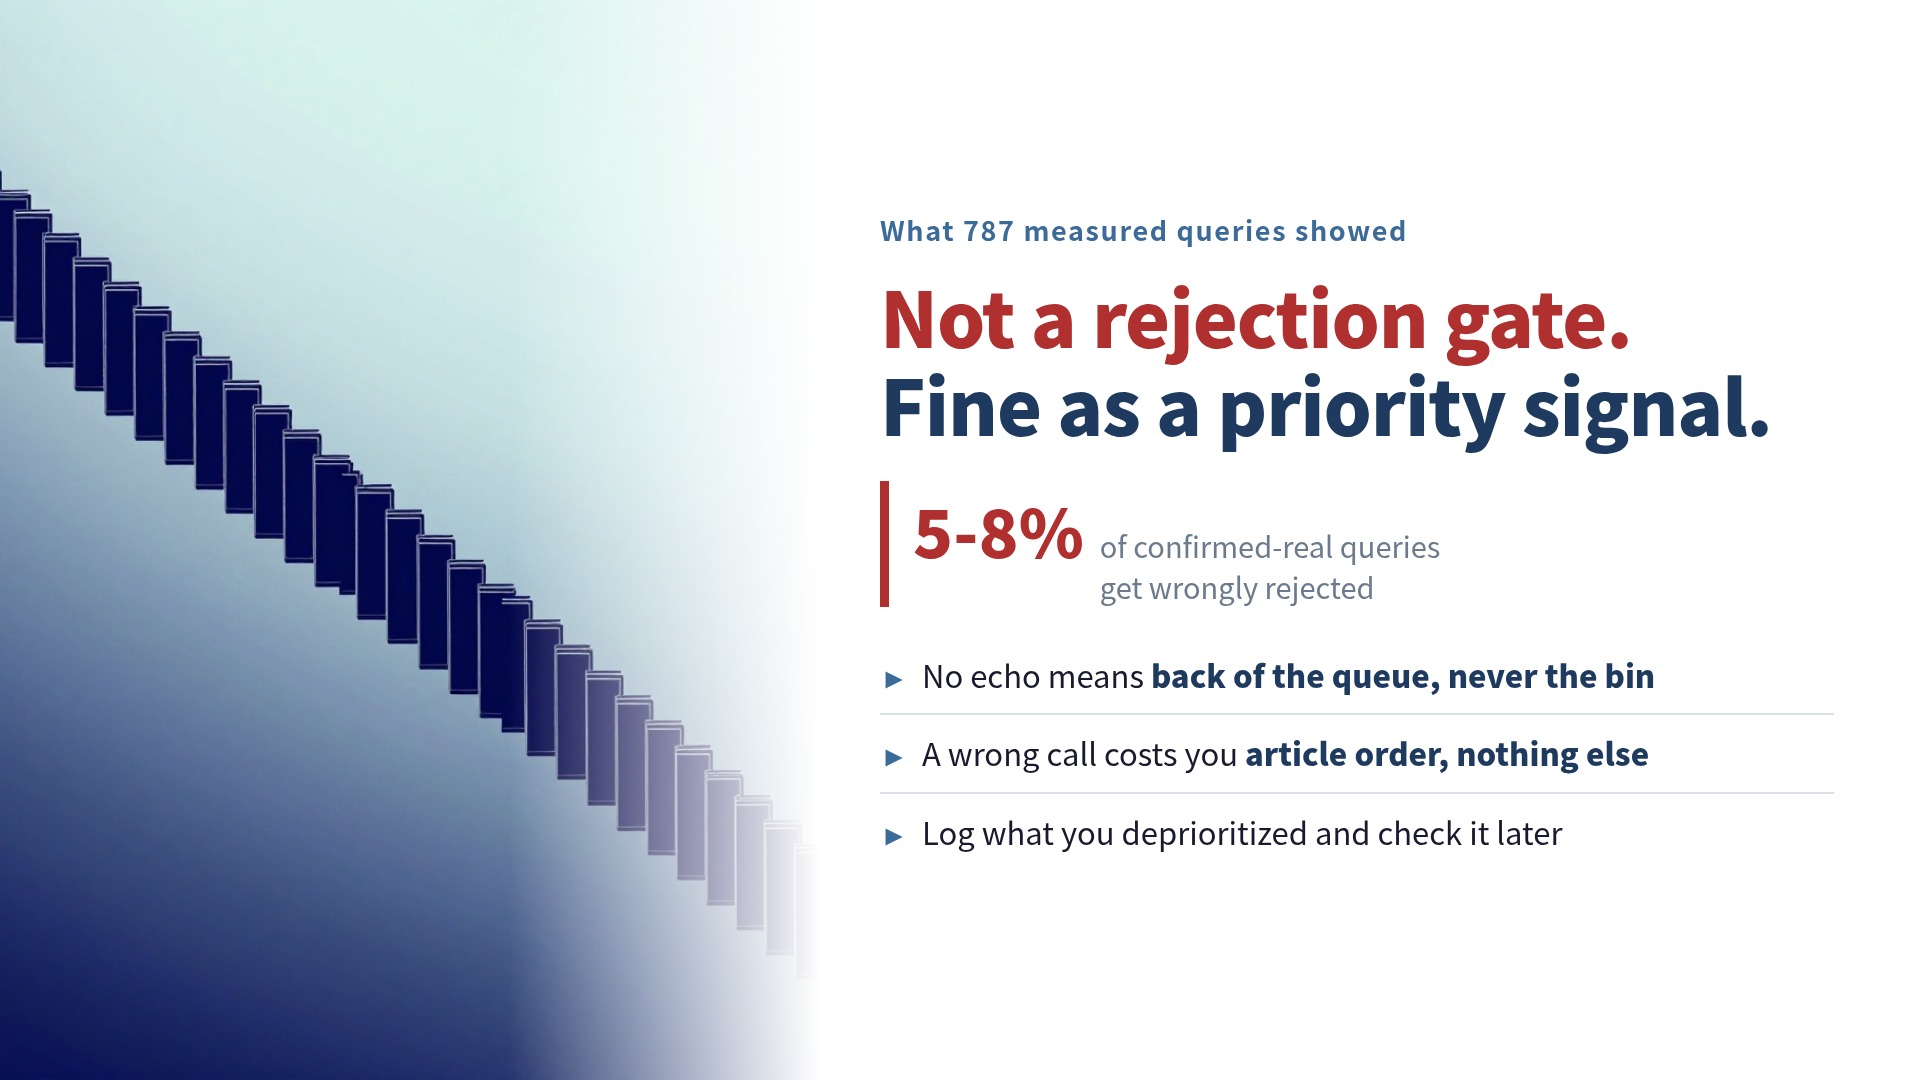
Accepting a 5–8% false negative rate to auto-reject topics does not pencil out for me. Count by topic instead of by query and it gets worse, and losing branded and question-shaped queries by construction is a real operational problem.
As a priority signal it works today:
- No echo means the term goes to the back of the queue, never to the bin
- Because nothing is rejected, a wrong call costs you article ordering and nothing else
- You can log the deprioritized terms and check later whether they ever picked up traffic
If you accept that counts are unavailable, “does anyone type this” is still free to answer. That beats knowing nothing. And looking at what I dropped, a fair share were AI-search question strings and operator queries that should never have been candidate topics to begin with. What you feed into the check may matter more than the five percent the check gets wrong.
The measurement lessons generalize further than the tool does. Zero is not evidence. Unequal sampling needs weights. Do not reclassify after seeing the answer. Those hold no matter what rule you are testing.
 Related book LLMO Quickstart Get cited by AI search in a weekend — 8 chapters of llms.txt, JSON-LD, and citation-rate KPIs distilled from the full guide View the book page →
 Was this article helpful?