I Mapped My Codebase as a Graph. The File That Broke Was Two Hops Away.
The change was one line. I renamed a function’s return type, fixed the two callers the compiler yelled about, ran the local suite, watched it go green, and shipped before lunch. Classic.
Auth went down in production about forty minutes later.
Not the file I touched. Not the two callers I fixed. A middleware I had genuinely forgotten existed, sitting two function-calls away from my edit, reading a field that used to be there and now wasn’t. Local CI never ran it because the integration test that would have caught it lived in a directory I wasn’t looking at. My one-line change had a blast radius, and I had been staring at ground zero the whole time, convinced it was the whole crater.
That afternoon I stopped trusting my eyes and built the thing I should have built years ago: a graph of my own codebase.
First, what this is not
If you’ve read anything about knowledge graphs lately, your brain probably just filed this under “RAG for documents” or “personal knowledge management.” Let me kill that association before it spreads.
This is not document GraphRAG. This is not a second brain. I am not embedding my Notion into a vector store. I’m talking about the most literal graph there is in software: functions call functions, files import files, classes inherit classes. Your codebase is already a directed graph. You just never get to see it, so you navigate it the way I did that morning: by guessing, by grep, by vibes.
A code dependency graph turns “this function is probably called from somewhere around here” into “this function is called from exactly these eleven places, and here is the path.”
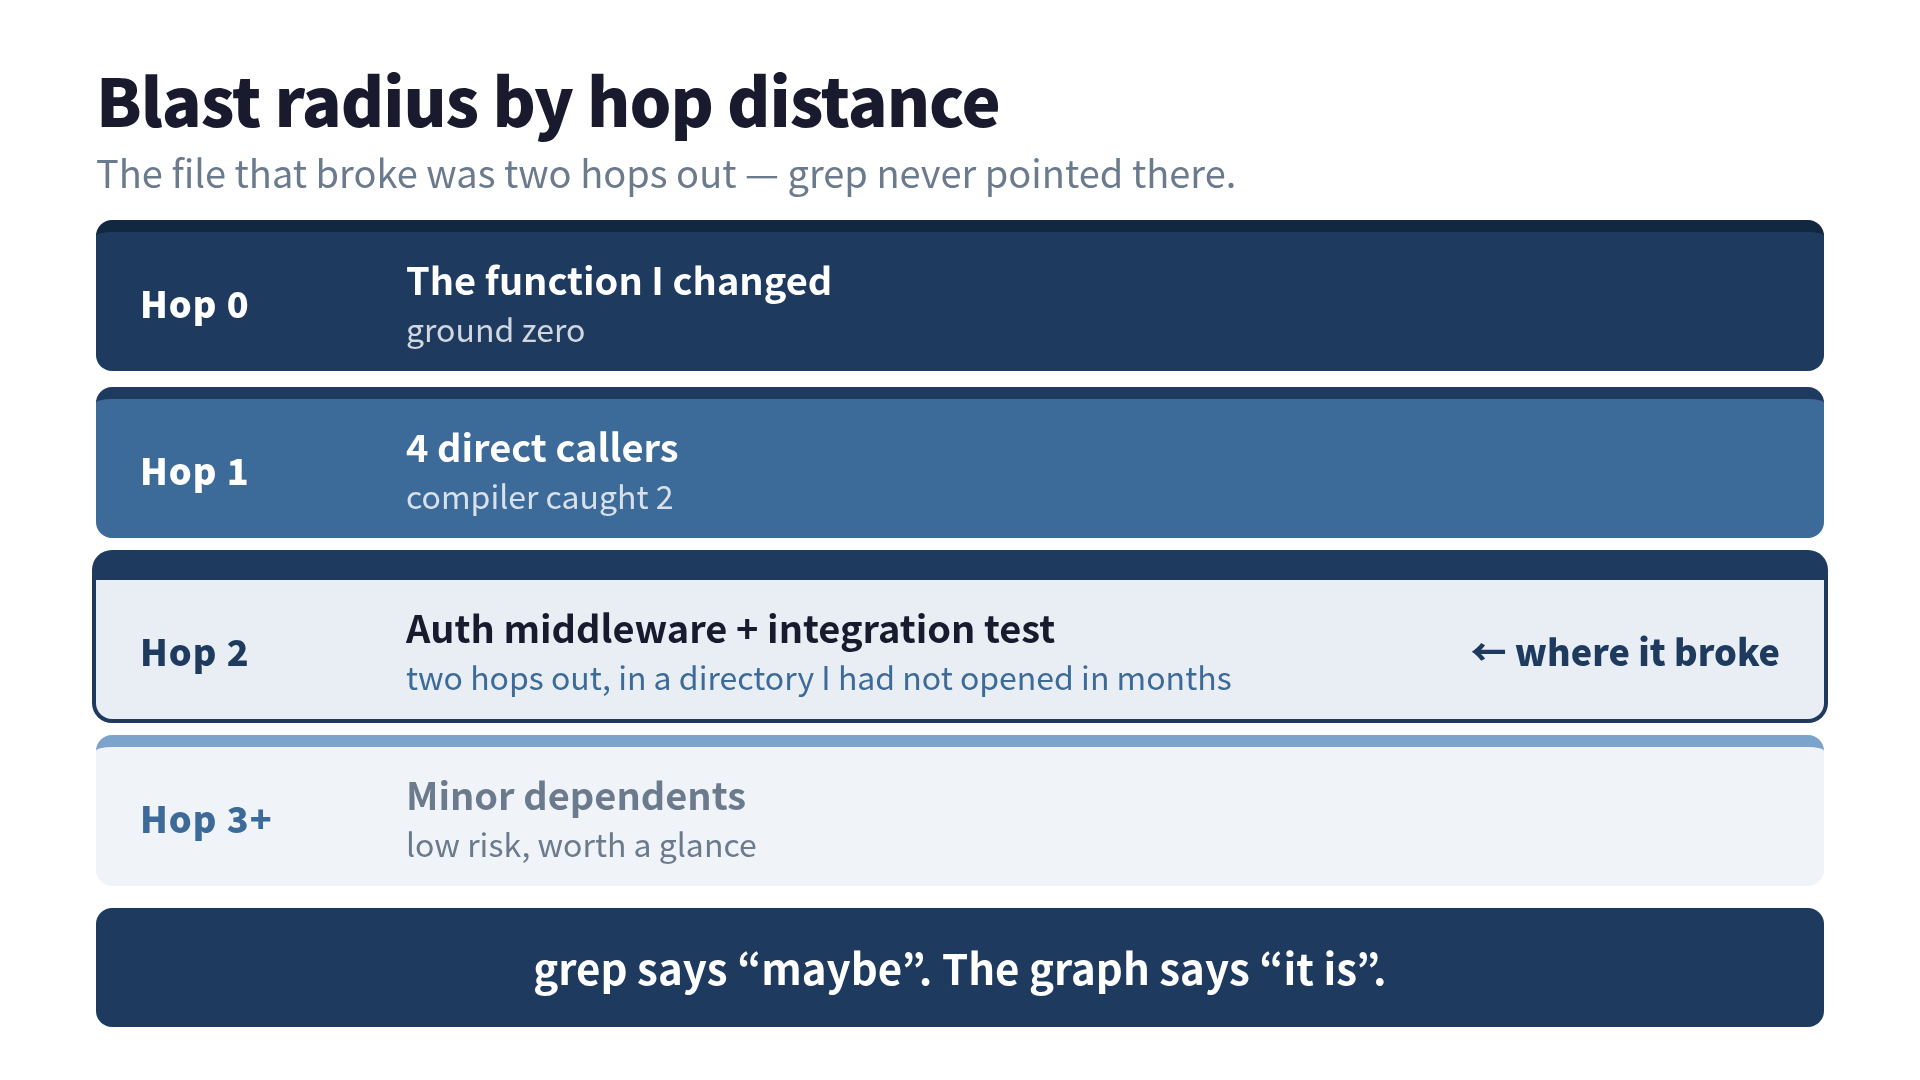
grep says “maybe.” The graph says “it is.”
Here’s the difference that actually mattered to me.
When I grep for a function name, I get every line where that string appears. Comments. A similarly-named function in an unrelated module. A log message. A test fixture. grep is a brilliant tool that has no idea what your code means. It matches text, and then I sit there doing the semantic analysis in my head, which is exactly the part of the job I’m bad at under pressure.
A dependency graph is built from the abstract syntax tree, the parsed structure of the code rather than the text of it. It knows that authenticate() on line 40 is the function being defined, that the authenticate on line 88 is a call to it, and that the # authenticate the user in a comment is nothing at all. So when I ask “what breaks if I change this,” it doesn’t hand me a pile of string matches to sift through. It hands me the actual callers, transitively, in order of distance.
The tool that builds that AST, by the way, costs zero LLM tokens.
Tree-sitter: deterministic, local, and boringly fast
The thing doing the parsing is Tree-sitter, the same incremental parser that powers syntax highlighting in editors like Neovim. It reads source code and produces a concrete syntax tree, completely deterministically, completely on your machine, no model in the loop.
People underrate how much that “no model” part matters. There’s no API call, so there’s no latency tax and no per-run cost. There’s no prompt, so there’s no nondeterminism: the same file parses to the same tree every time. And your code never leaves the laptop, which means I can run this against a client’s private repo without a single byte going to a third party. For the structural layer, who calls whom and who imports what, you genuinely do not need an LLM, and bolting one on would only make it slower and less reliable.
Coverage is wide enough that language is rarely the blocker. Tree-sitter’s core ships official grammars for a few dozen languages, and the community language packs push that well past 300. Whatever your service is written in, there’s almost certainly a grammar for it.
Blast radius, by the hop
The payoff is a query I now run before every non-trivial change: what’s the blast radius?
You pick the function you’re about to touch, call that Hop 0, and walk the call graph outward. Each step out is one hop, and the hops sort your risk for you.
When I ran this on my own WebRTC backend against that token helper, the picture was unambiguous:
- Hop 0 — the function I edited. The crater I’d been staring at.
- Hop 1 — the direct callers. Four of them. These were the two the compiler flagged, plus two it didn’t because they passed the value through generically.
- Hop 2 — here it was. The auth middleware that read the field, and the integration test that exercised it. Two hops out, in a directory I had not opened in months.
- Hop 3 and beyond — a handful of tests-of-tests and a metrics exporter. Real dependents, low risk, worth a glance and nothing more.
The whole walk finished in a couple of seconds, no network, no tokens. The file that took down production in the morning was sitting right there at Hop 2. The moment I had a graph, it stopped being a forgotten file and became a labeled node with an arrow pointing straight at my edit.
Hop distance turns out to be a shockingly good proxy for “how worried should I be.” Hop 1 you already know about; the compiler usually tells you. Hop 2 is where the ghosts live: the indirect dependents you’ve mentally written off. Hop 3+ is mostly noise you can scan and dismiss. The graph doesn’t just find the dependents; it ranks them, which is the part my tired 11am brain could not do on its own.
How I actually wired it up
You do not need a graph database or a weekend to try this. The minimum viable version is smaller than the bug it prevents.
- Parse with Tree-sitter. Use the
tree-sitterCLI or a binding likepy-tree-sitter. Walk each file’s tree, pull out function definitions and call expressions. This is the only real work, and the grammars do most of it. - Build the edges. A call from
AtoBis an edgeA → B. Two dictionaries — callers and callees — get you surprisingly far before you reach for anything heavier like a real graph store. - Query by hops. Blast radius is just breadth-first search from your changed node, tagging each node with its hop distance. That’s the whole feature.
If your codebase is big or polyglot, established tooling already does the heavy lifting: ast-grep for structural search, Sourcegraph’s SCIP for cross-repo indexing, GitHub’s own code navigation. But the home-grown version taught me more about my own architecture in an afternoon than two years of working inside it had.
What changed after
I won’t pretend I now run a blast-radius query before renaming a variable. That would be its own kind of broken. But for anything that touches a shared type, an auth path, or a function with more than a couple of callers, I look at the graph first. The question shifted from “what calls this, probably?” to “show me the nodes within two hops,” and that second question has an answer I can trust instead of one I have to nervously double-check.
The morning incident cost me a rollback, an apology, and a genuinely unpleasant Slack thread. The graph cost me an afternoon. I have since shipped at least three changes where Hop 2 lit up red and I quietly fixed the dependent before anyone’s auth went anywhere. None of those became stories, which is exactly the point: the best incidents are the ones that never happen.
grep will still tell you where a string lives. It’s a great tool and I’m not giving it up. But when the question is “what will I break,” I’d rather have the graph say it is than have grep shrug and say maybe.
If you want to go deeper on turning code into a graph — Tree-sitter ASTs, blast-radius queries, and the schema design behind a real code knowledge graph — I wrote a full book on it: The Practical Knowledge Graph Guide.
Was this article helpful?