I Refactored 100 Functions With Claude. 7 Got Slower in Production.
I asked Claude Code to refactor 100 functions across a Python service I owned. It did the job in two passes. CI was green on both. The PR description was so neat I almost felt bad shipping it on a Friday.
Two weeks later, on-call paged me because the p95 of one endpoint had drifted from 180 ms to 240 ms. I started bisecting. The bisect landed on the refactor PR. I started reading the refactor PR. Seven of the 100 functions were slower in production. CI never noticed because CI does not measure “slower.” It measures “returns the same value.”
This post is about what those seven slow functions had in common, why mutation tests and unit tests both missed them, and the four checks I now run before I let Claude, or any AI, refactor anything that ships under load.
The setup, so you can tell whether this generalizes
The codebase: a Python 3.12 service with about 18 k lines of business logic, FastAPI on the edge, asyncpg to Postgres, a Redis cache, and a CPU-bound scoring module that runs on every request. The 100 functions were a curated batch: small to medium, pure where possible, all with unit tests. I asked Claude Code to apply a standard set of cleanups: early returns, extracted variables for magic numbers, comprehensions where loops did one thing, dataclass conversions for ad hoc tuples.
I was deliberate about scope. No rewrites. No architectural changes. No “while you are in there” rewiring. Two batches of 50, each shipped as its own PR, each with its own CI run on an 8-core runner. The unit tests passed. A mutation testing run with mutmut came back clean. Kill rate on the refactored modules went from 78% to 81%. By every signal I had, the code was equivalent and slightly better.
Which is exactly the kind of confidence that gets you a Friday page two weeks later.
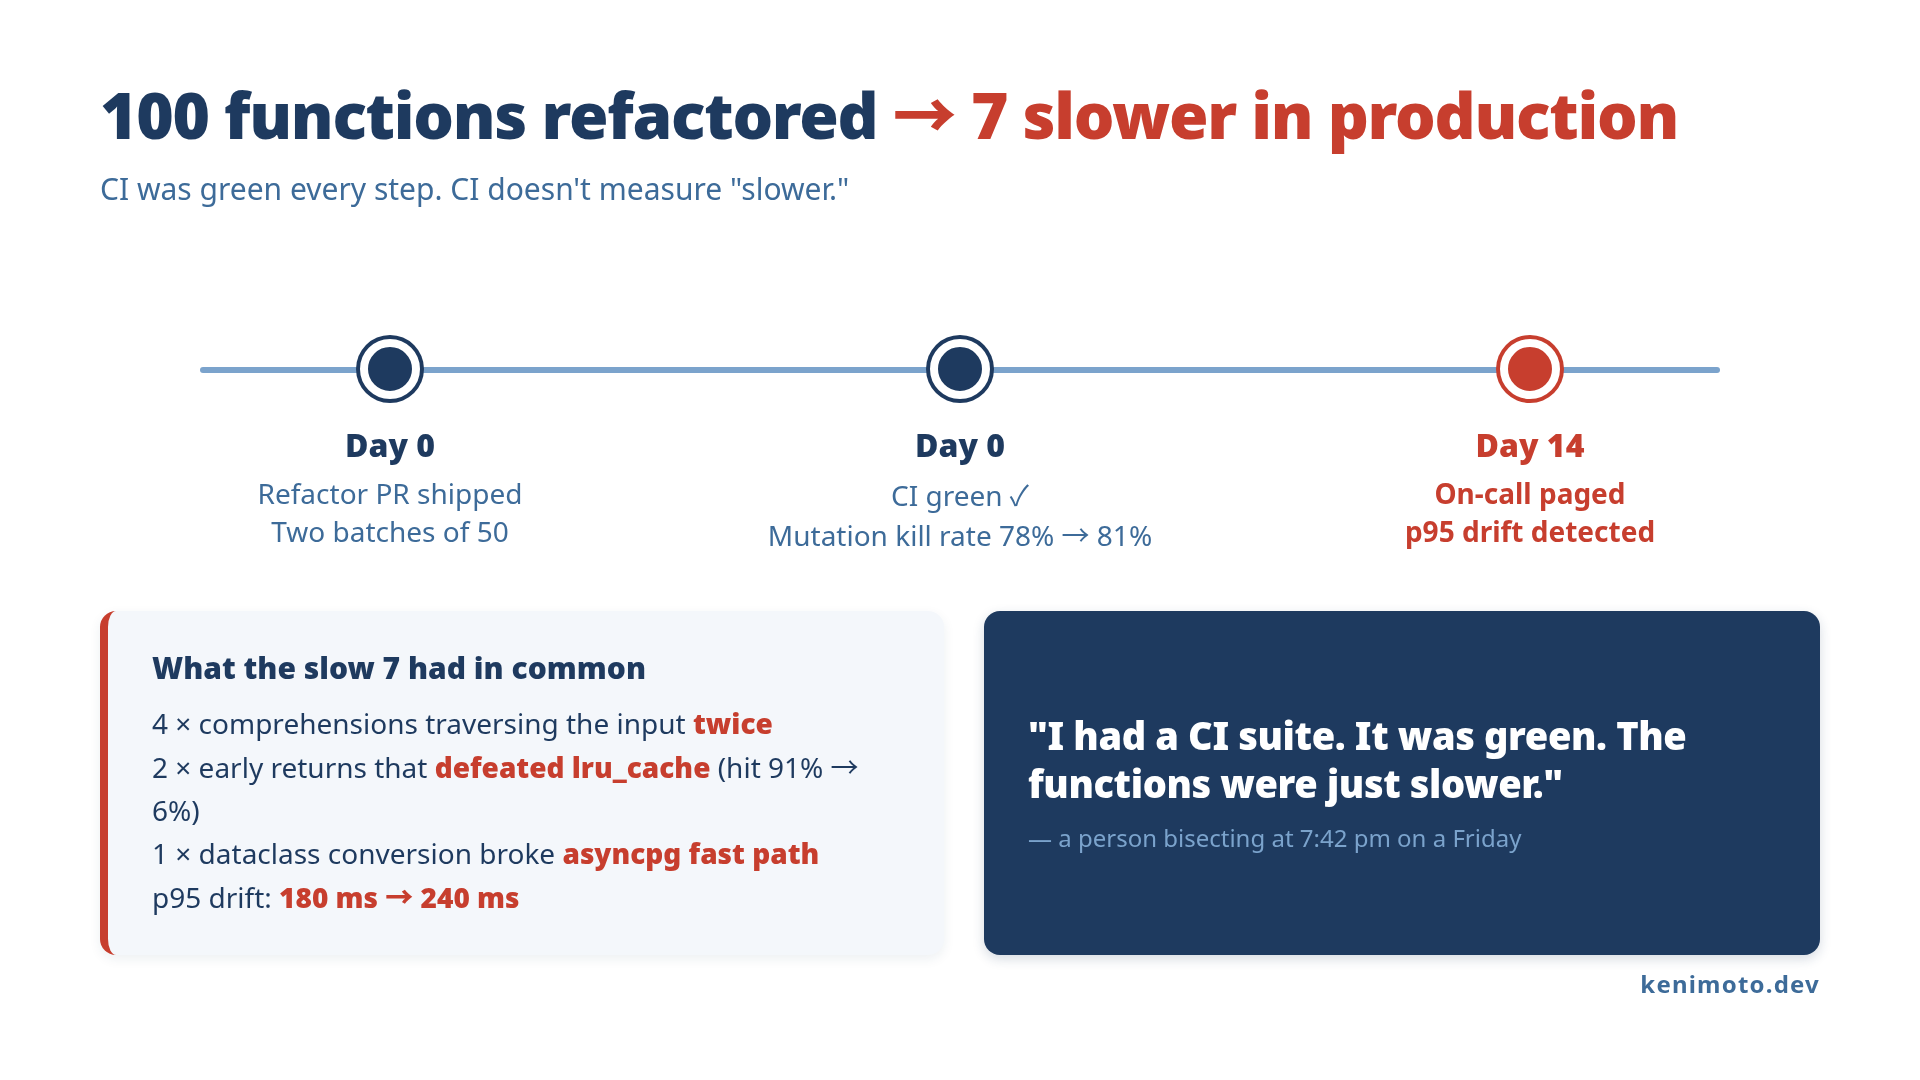
What the slow seven had in common
When I sat down to read the seven slow functions side by side, three patterns showed up. None of them are obvious. All of them are the kind of thing CI is structurally unable to catch.
Pattern 1: comprehensions that traverse twice. Four of the seven were loops that Claude folded into a list comprehension. The comprehensions were correct. They were also walking the input twice (once to filter, once to map) because Claude had separated the predicate and the projection for readability. The original loop did both in one pass with an if and a continue. On a list of 50 items that runs once per request, the difference was 1.4 ms. On the hot path, multiplied across the request, it was about 12 ms of p95.
I would have caught it in code review if I had read the old and new code line by line. I didn’t, because the diff looked like a textbook “extract comprehension” cleanup and the test passed.
Pattern 2: early returns that defeated a cache. Two of the seven used @functools.lru_cache on the outer function. Claude added a guard clause that returned None for invalid input before the cache lookup. The intent was defensive: fail fast on bad input. The effect was that the cache stopped getting populated for the entire valid-input path, because the function now returned through a path that wasn’t memoized. Hit rate dropped from 91% to 6% on that function. The function itself was fast. The 85-point hit rate drop wasn’t.
You will not catch this in a unit test. You catch it in a load test, or in production, or by reading the function with the question “what was this function’s role in the system, not just its contract.”
Pattern 3: dataclass conversion that broke the asyncpg fast path. One function used to return a tuple that asyncpg could unpack directly into its row decoder. Claude converted the tuple to a dataclass with the same fields, which is structurally cleaner and semantically identical. It also forced an extra allocation and a __init__ call per row. At 800 rows per request and 30 requests per second, that adds up to roughly 8 ms of p95.
This one is my favorite, because it is the cleanest example of “the refactor is correct and the refactor is wrong.” The code reads better. The system is slower.
Why CI and mutation testing both said yes
I want to spend a paragraph here because it took me a while to internalize this.
Unit tests verify that the function returns the same value for the same input. They do not verify that it returns the same value in roughly the same time, with roughly the same allocation pattern, holding roughly the same locks. Mutation testing verifies that your tests would notice if the code’s logic changed. It would also not notice “this function now allocates a dataclass per row instead of unpacking a tuple,” because mutation testing’s mutators don’t include “swap the data structure.”
In other words: every tool I had in my CI pipeline was answering the question “is this code correct?” Not one of them was answering “is this code as fast?” That gap is exactly where Claude’s refactors landed. The cleanups were correct. They were just slower in ways that only show up under real traffic.
I had a CI suite. It was green. The functions were just slower. CI doesn’t measure “slower.”
The four checks I run now
After the page, I built four checks into my refactor flow. Three are automated. The fourth is a 10-minute reading. I am sharing them because I have read every “let AI refactor your code” post on Dev.to this quarter and not one of them mentions performance verification.
Check 1: a baseline benchmark before the refactor. I run pyinstrument on the top 20 endpoints with a recorded production-shaped trace and save the report. The report names every function on the hot path with p50, p95, and allocation count. Pre-refactor, you should know which functions matter. Without this baseline, you cannot say “this function got slower”. You can only say “the service feels slower”, which is what brought me here in the first place.
Check 2: the same benchmark after the refactor, with a diff. Same trace, same script, diff the two reports. A drift of more than 5% on any function in the top 50 by self-time is a flag. Not a block. A flag. You investigate.
Check 3: a load-shaped soak. I run locust for 10 minutes at 80% of peak production load against the refactored build and watch cache hit rates, allocation rates, and DB connection acquisition time. This is what would have caught the lru_cache regression. Hit rate drop from 91% to 6% screams in a five-minute soak. It is silent in unit tests forever.
Check 4: read the diff for “structural changes I asked for vs. structural changes I got.” I open the diff, find every changed function, and ask one question: “did this change touch the data structure, the iteration pattern, the cache boundary, or the lock acquisition?” If yes, it goes in a second list for a slow read. The slow read takes about 10 minutes per 100 functions. It would have caught five of my seven.
I now treat AI refactoring as a junior engineer’s PR: I trust it on style, I check it on substance, and I never merge it without a load test if it touched the hot path. That sounds harsh. It is the same standard I would hold a human contributor to. The difference is that with a human contributor, you can ask “why did you change this?” and get a reason. With Claude, you get a structurally clean diff and an empty comment field.
What I do not do
I do not avoid Claude for refactoring. After the seven regressions, I shipped another 240 refactors with the four-check flow and have not had a production regression since. The flow takes about 20 minutes per batch of 50 functions. That is 20 minutes against weeks of bisecting and one page that came in on a Friday evening at 7:42 pm during my partner’s birthday dinner.
I also do not refactor “while in there” anymore. Refactor PRs are refactor PRs. Feature PRs are feature PRs. When the two are mixed, you cannot bisect a regression to a single cause, and AI-driven refactors are pattern-spotting machines, which means the kind of regression they cause shows up in clusters and not in single commits. Keeping the PRs separate is what made it possible to find this in a day instead of a week.
The lesson, if there is one, is small: the boring stuff CI doesn’t measure is exactly where AI refactors will leave their fingerprint. Measure it.
This article touches a slice. The full Claude Code playbook (CLAUDE.md patterns from 2 lines to 100, Plan Mode workflow, team operations, the patterns I use to keep AI inside a safe lane on a real codebase) is in Practical Claude Code.
If you liked this post, you might also like TDD With Claude Code: The Test Was Written After the Code Six Times Out of Ten and Claude Hid My Bug Three Times: Ten Debugging Prompts That Actually Help. Same “Claude is confident, the diff is clean, the system disagrees” theme, different failure mode.
 Related book Practical Claude Code The field guide for engineers who use Claude Code every day — CLAUDE.md, Plan Mode, and team workflows from a year of real production use View the book page →
 Was this article helpful?