I Cron-Scheduled 7 AI Agents. 2 Silently Failed for 18 Days. Tracing Wouldn't Have Caught It.
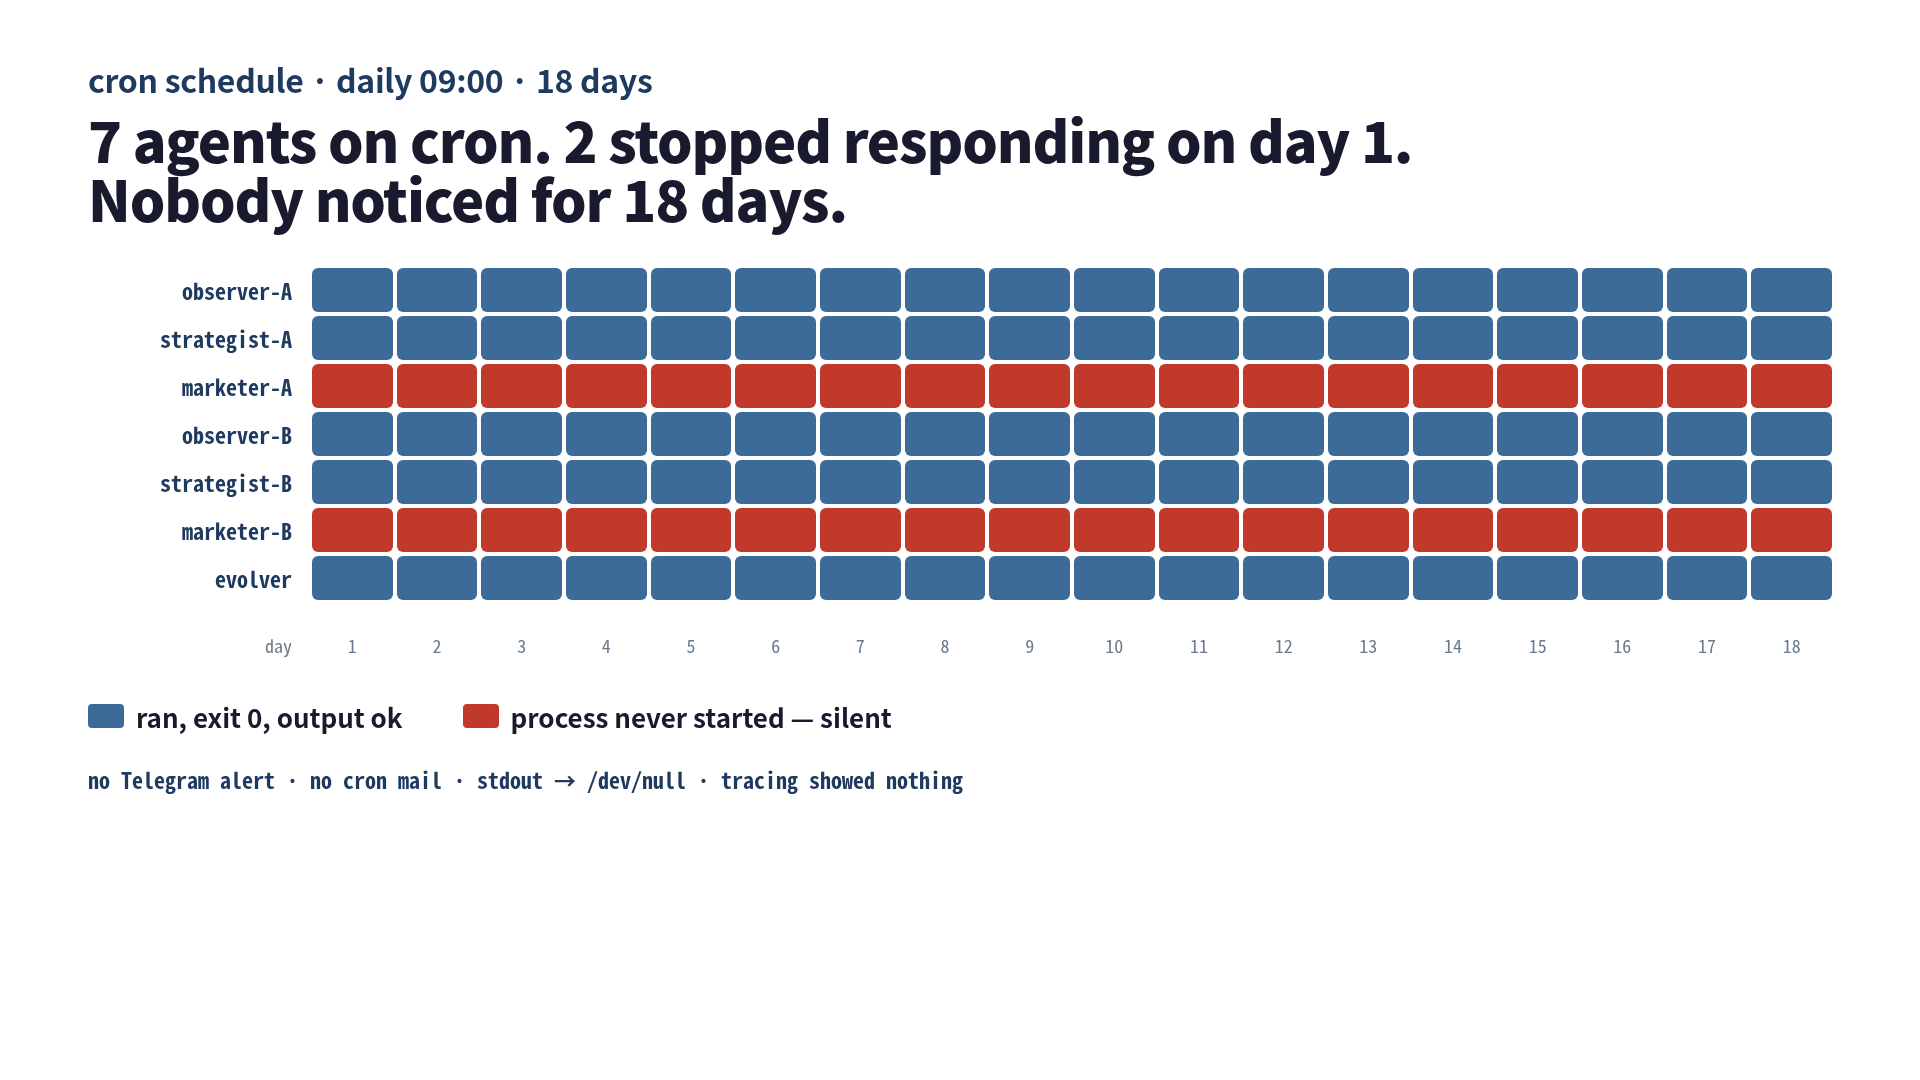
I had seven agents on cron. Two of them stopped running on day one. I noticed on day eighteen.
That sentence is the whole article, but it is also the kind of sentence that I would have argued against if someone else had said it on a podcast. “Surely you would notice. You have tracing. You have dashboards. You have a Telegram channel that lights up every time anything moves.” Yes. I had all of those. The two dead agents still slipped under all of them, because every one of my monitoring layers was designed to watch processes that ran. Two of mine were not running.
This is the eighteen-day log: what the seven agents were, how two of them silently broke on day one, why my tracing was the wrong shape for the failure, and the small exit-code contract I now bolt onto every scheduled CLI agent.
The seven agents and the setup that looked fine
I run two content domains and one self-evolving harness on the same box. Each domain has three agents on a daily cron at 09
— observer, strategist, marketer — plus a shared evolver that runs on Saturdays. That’s seven processes. The cron lines all looked roughly like this:0 9 * * * /home/me/repos/harness-ops/scripts/marketer-A.sh >/dev/null 2>&1
0 9 * * * /home/me/repos/harness-ops/scripts/marketer-B.sh >/dev/null 2>&1Each shell script wraps claude -p "..." with a prompt, captures the output, writes a daily log file, and ends. A real article gets pushed at the end if the agent decides to publish. I have a Telegram webhook that fires from inside the script on success and on set -e failure paths. I had been running this setup for about two months before the silent failures.
The thing I missed at setup time was three lines below the heredoc. The two marketer scripts referenced a Python helper that lived in a sibling repo. I had cdd into that sibling repo at some point and tested everything by hand. The script worked. I checked it in. Then I tidied the sibling repo, renamed the helper module, and the import line in my marketer script started to point at nothing.
You can already see what happens. python3 helper.py ... exits with code 1 immediately on ModuleNotFoundError. The shell script’s first line is set -euo pipefail. So the script dies in the first ten lines. Telegram is wired up later in the script, after the Python call. The script never reaches the Telegram block. >/dev/null 2>&1 swallows the stderr. Cron is configured without MAILTO=. Two agents die quietly every morning. The other five publish like normal. The system looks healthy.
What tracing was watching, and what it was not
I want to be precise about this part, because I spent a few hours on day eighteen convincing myself that better tracing would have caught it. It would not have.
I had OTEL spans coming out of every claude -p invocation. They went into a self-hosted collector and out to a small dashboard. The dashboard showed: tokens per task, tool-call latency, retry rate, daily total agent runs. On the morning of day eighteen the dashboard showed five agent runs per day, every day, for the last eighteen days. The line was perfectly flat. The line was supposed to be at seven.
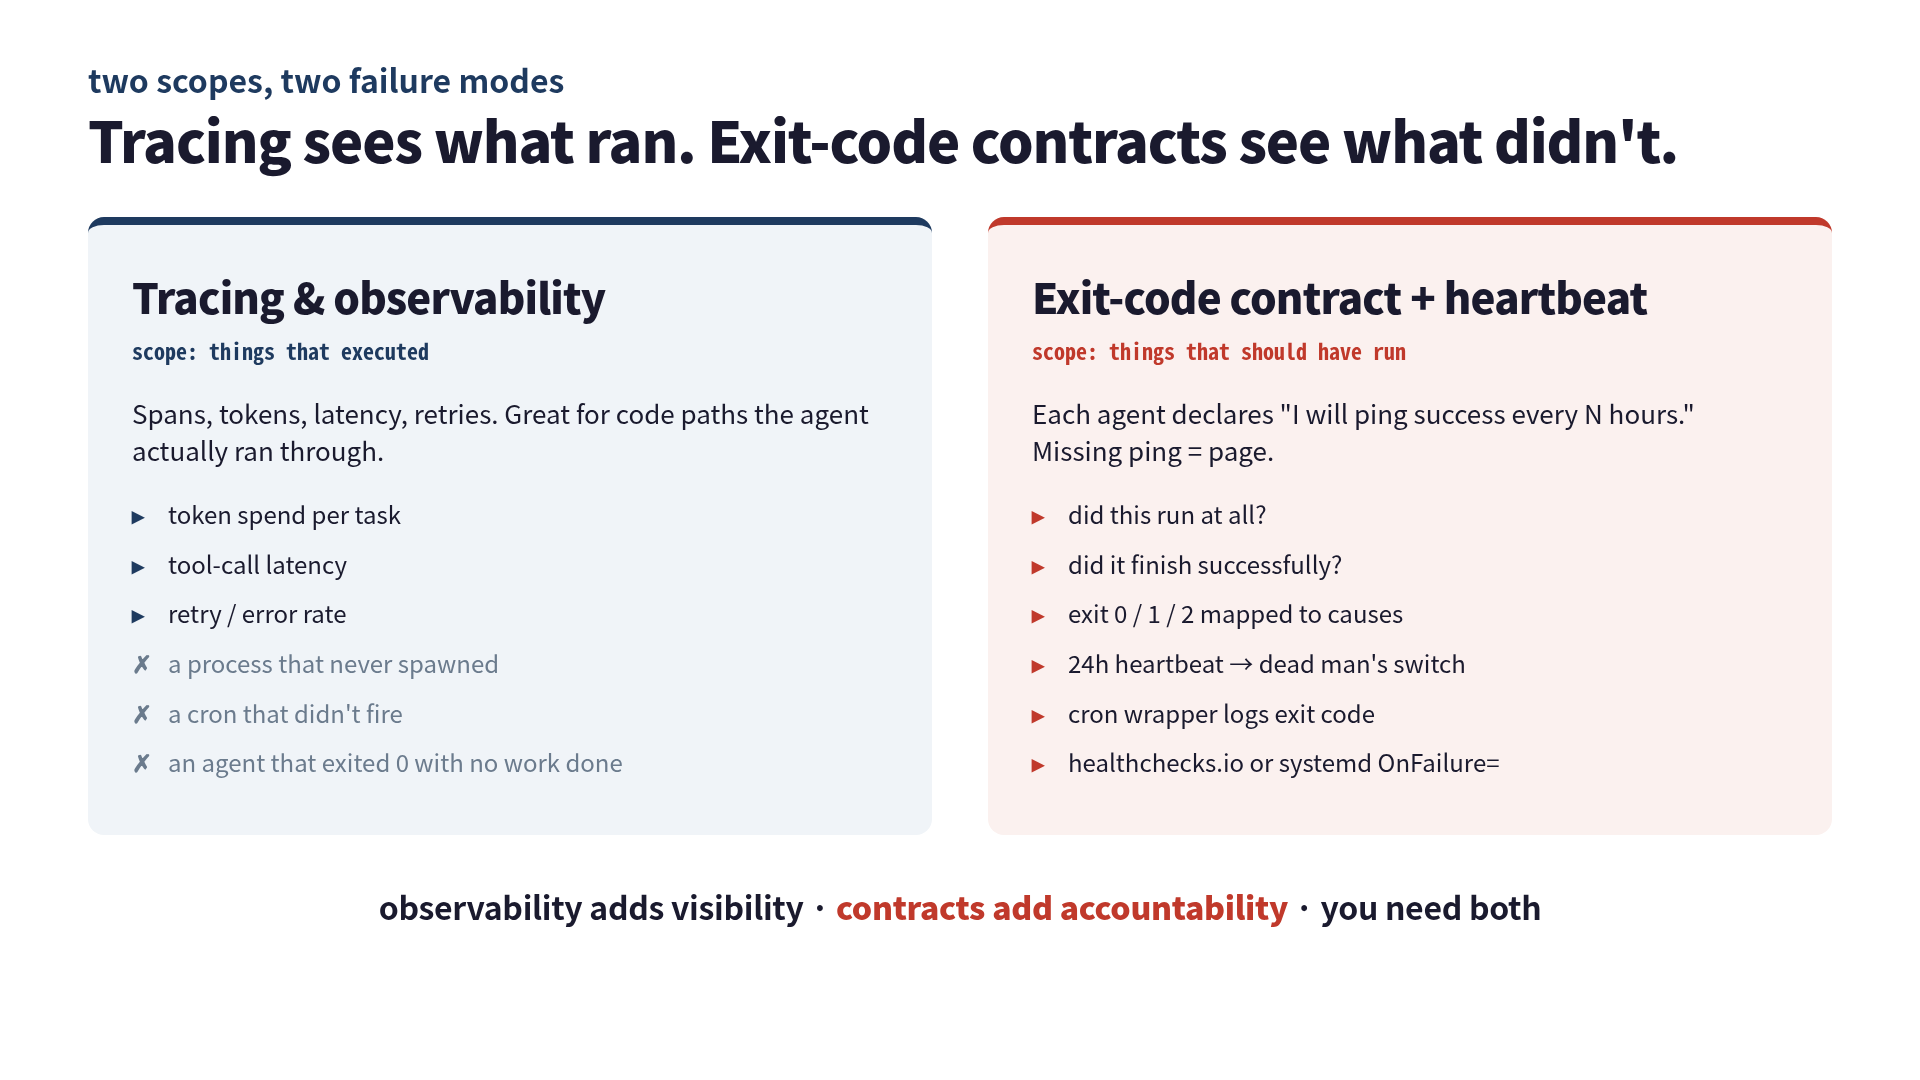
Tracing instruments processes that execute. It can show you a slow call. It can show you a failed call. It can show you a retry storm. It cannot show you a process that was never spawned. The two dead marketers had no spans because the only span emitter was inside the very Python helper that was failing to import. From the dashboard’s perspective, those two agents simply did not exist that day. And the next day. And the next.
I had been staring at the wrong question. “Are my agents healthy?” is a question that tracing answers. “Did all seven of my scheduled agents actually run?” is a question that tracing cannot answer, because the agents that did not run are exactly the ones that send no signal.
If you have ever read about healthchecks.io’s dead-man’s-switch model, this is the exact failure mode they describe in their docs: “A critical data processing job might stall without triggering any alarms in traditional monitoring systems. These silent failures can persist for days or weeks before someone notices missing data or corrupted results.” I had read that page before. I just hadn’t applied it to my own cron because I had Telegram alerts and felt covered. Telegram only fires from code paths that the script actually reaches.
The exit-code contract I bolted on
The fix did not involve more observability. It involved less trust in the agents to report themselves, and more trust in the cron wrapper to report on their behalf. I gave every scheduled agent a small contract:
- Define exit codes that mean something. Not just
0 = good, anything else = bad. I cribbed loosely from sysexits.h:0is “agent ran and finished its task,”64is “config or env error” (theModuleNotFoundErrorcase),65is “task ran but produced no usable output,”78is “agent skipped on purpose” (e.g., the marketer decided there was nothing to publish today). - Make the cron wrapper own the reporting. The agent script’s job is to exit with the right code. The cron wrapper’s job is to pick up that code and push it somewhere durable — regardless of whether the agent itself succeeded or failed.
- Add a heartbeat that fires on success. Not on failure. Silence has to be the alarm.
The cron wrapper now looks roughly like this:
#!/usr/bin/env bash
# scripts/cron-wrap.sh <agent-name>
set -uo pipefail
AGENT="$1"
SCRIPT="$HOME/repos/harness-ops/scripts/${AGENT}.sh"
HC_URL="https://hc-ping.com/<uuid-${AGENT}>"

START=$(date -Iseconds)
bash "$SCRIPT"
RC=$?
END=$(date -Iseconds)

# log every run, success or not
echo "${START} ${AGENT} rc=${RC} end=${END}" >> "$HOME/logs/cron-runs.log"

# ping the heartbeat URL with the exit code embedded in the path
# missing ping for 24h → healthchecks.io pages me
curl -fsS --retry 3 "${HC_URL}/${RC}" >/dev/null || true

# escalate non-zero immediately, but never let cron itself fail
if [[ "$RC" -ne 0 && "$RC" -ne 78 ]]; then
  "$HOME/bin/tg-notify.sh" "agent=${AGENT} rc=${RC} see ~/logs/cron-runs.log"
fi
exit 0
Three things in there that took me a couple of evenings to get right.
First, set -uo pipefail instead of set -euo pipefail. I do not want the wrapper to exit on the agent script’s failure, because if it exits before the ping, healthchecks.io will eventually page me — but the page will arrive 24 hours late, and the log line will not be written. The wrapper has to keep running and capture the exit code itself.
Second, the ping URL has the exit code in the path. healthchecks.io accepts that and exposes it in the dashboard as the last reported code. So I can glance at a list and see “agent ran, exited 64” without opening the log file. Cronitor does the same thing with a slightly different URL shape; pick whichever fits your existing tooling.
Third, 78 is treated as a deliberate skip, not a failure. The marketer’s “no, nothing worth publishing today” path returns 78. Without that, the failure escalation would fire on legitimately quiet days and I would learn to ignore the channel — which is how monitoring dies in practice.
What it caught the day I deployed it
I rolled this out on what was day eighteen for the silent marketers. Within ten minutes, both marketer-A and marketer-B showed up in the healthchecks.io dashboard with last-reported exit code 64 — config error, the module that did not exist anymore. I had not opened the agent code yet. I just looked at the dashboard.
Within an hour I had renamed the import, run both scripts manually to verify exit 0, and the next morning’s cron published the two articles those agents had been quietly skipping for two and a half weeks. Tracing dashboards finally went up to seven runs per day. The line is still flat, but it is flat at the right number now.
The day after that, a different agent — observer-B, which had been totally fine throughout the silent failure period — started exiting 65 (“no usable output”). The dashboard caught it inside twenty minutes. That is the kind of thing the contract is supposed to do: when the agent ran but produced garbage, you find out the same day, not the same fortnight.
What I’d tell past-me
The version of me who set this cron up two months ago was not careless. He had set up Telegram alerts and a tracing dashboard and a daily log file. He had read the Twelve-Factor App chapter on disposability. He had even thought about the difference between “agent failed” and “agent did not run,” and decided the latter was unlikely enough to ignore.
The mistake was assuming “did not run” was a rare edge case. In a setup with seven scheduled processes, three Python helpers, two repos that move independently, and a long-running script that wires Telegram in the middle rather than at both ends, “did not run” is the single most likely silent failure mode. It is not even close.
So three things I would say to past-me, in order of how cheap they are to set up:
MAILTO=is free. If you set it, cron itself will email you the stderr of any failing job, even the ones that die before your alerting code runs. That alone would have caught my failure the same morning it happened. (archwiki has a good summary on systemd timers and email if you have moved off cron.)- Wrap every scheduled agent in a script you own. Not the agent itself — a wrapper around the agent that has one job: capture the exit code and ping somewhere. The wrapper is allowed to be uglier than the agent because it should never change.
- The success heartbeat is what makes silence loud. Failure alerts are everywhere, and they tell you nothing about agents that never executed. A heartbeat that fires on success — and a dead-man’s-switch that pages when the heartbeat is missing — turns “two agents went quiet” from an eighteen-day discovery into a one-day discovery.
Tracing and observability are how you watch processes that are alive. An exit-code contract is how you remember they were supposed to be alive at all. The two complement each other, and the cron-based “set it and forget it” pattern collapses without the second one. Mine did, for eighteen days, quietly, on a server I checked every morning.
I checked the dashboards. The dashboards were just looking at the wrong question.
Related
- I Ran 3 Claude Code Sessions in Parallel for 8 Hours. They Overwrote Each Other’s Context Twice. — sibling failure on the synchronous side: agents that collided rather than disappeared.
- I Added a 4th Agent That Audits My Other Agents (Evolver). — supervising agents that are running but procrastinating; complementary to the contract-level checks above.
- 9 Bugs in My AI Pipeline: None Were the AI’s Fault. — full bug catalogue from the surrounding scripts; silent-cron was #7 on the list.
If you’d rather go deeper than a single blog post, I expanded the lifecycle-and-hooks layer of this story into a chapter of my book on AI agent harnessing: Harness Engineering Guide: From Tools to Compounding Productivity.
Was this article helpful?