Five Days of Tracking 346 Aftershocks From 90 km Away — and a Rematch With the 2016 Kumamoto Earthquake
Just past 10 p.m. tonight my desk slid sideways for a second. Ten minutes later I pulled up my CLI:
$ quake-lens recent --limit 3
time                      lat       lon   depth   mag  src   place
2026-08-01T13:03:00Z   32.300   130.500     0.0   2.3  p2p   Kumamoto (Amakusa)
2026-08-01T12:47:00Z   32.700   130.700    10.0   4.7  p2p   Kumamoto
2026-08-01T12:36:00Z   34.200   139.200    10.0   1.8  p2p   Niijima-Kozushima
M4.7 at 21:47 JST, intensity 3 on the JMA scale here in Fukuoka. My desk was right.
On July 28, a M7.1 earthquake (JMA magnitude; Mw6.8, registered by USGS as the 2026 Uto, Japan Earthquake after the small city sitting right above the epicenter) struck Kumamoto, about 90 km south of where I live. In my previous post, written the day after the mainshock, I walked through why earthquake prediction is impossible while aftershock forecasting is respectable statistics. This is the follow-up: five days of daily measurements on a live aftershock sequence.
346 aftershocks, 34 of which reached my city
Counting from the mainshock to 10 p.m. on August 1, the JMA earthquake feed lists 346 aftershocks in the Kumamoto region. Cross-referencing the P2P Earthquake network’s per-station intensity data, exactly 34 of them registered intensity 1 or higher at stations in Fukuoka Prefecture.
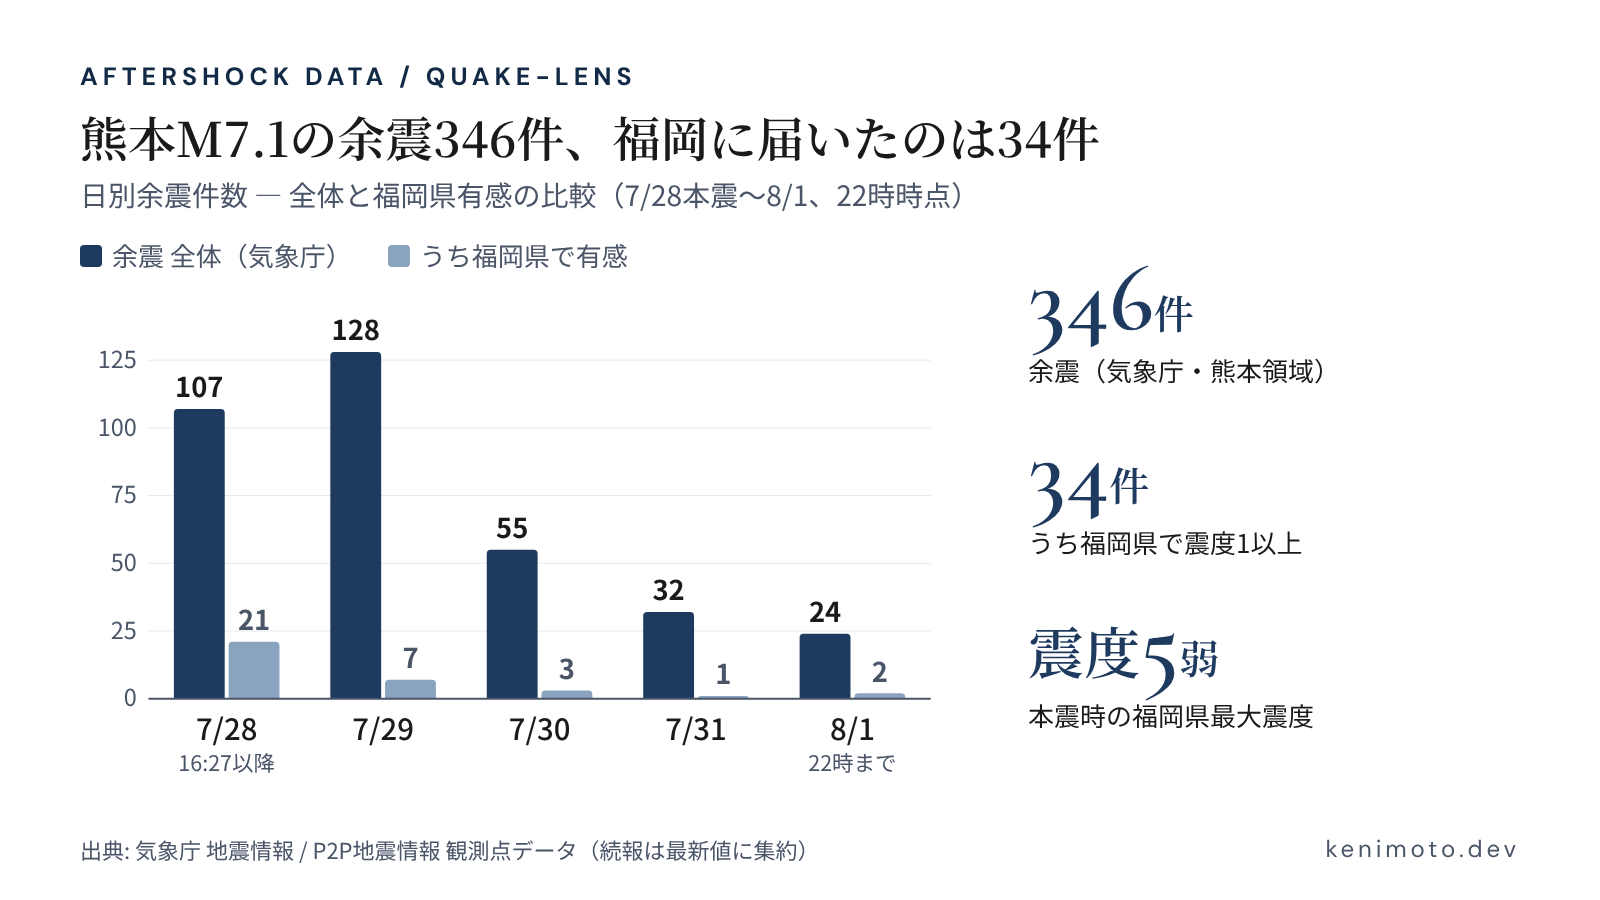
| Day | All aftershocks | Felt in Fukuoka |
|---|---|---|
| Jul 28 (after 16:27) | 107 | 21 |
| Jul 29 | 128 | 7 |
| Jul 30 | 55 | 3 |
| Jul 31 | 32 | 1 |
| Aug 1 (to 22:00) | 24 | 2 |
The ratio is the interesting part. When Kumamoto shakes a hundred times, Fukuoka feels about ten of them, and nearly all of those are M3.5 or larger. Distance is a magnificent low-pass filter. Only three aftershocks reached intensity 3 here: the M6.1 that came 41 minutes after the mainshock, a M5.8 the next evening, and tonight’s M4.7.
Checking the Omori-Utsu forecast against reality
Fitting all 346 events to the Omori-Utsu law (aftershock rate decays as a power of time — an empirical law dating back to 1894) gives:
$ quake-lens omori uto_jma_seq.json --mainshock 2026-07-28T07:27:15Z
K       = 138.2964
c       = 0.3425
p       = 1.2163
n_used  = 346
p = 1.22, dead center of the textbook range (1.0–1.4). The fitted model puts the rate at day 4.2 around 22 events per day; the observed count for August 1 was 24. Within ten percent.
If the decay holds, the model says roughly 12 events/day by August 4 and 5 by August 11. But as in the previous post: this forecasts frequency, not the next big one. Tonight’s M4.7 sat right on a decaying curve and still rattled my desk. A falling rate is comfort, not permission to relax.
For the record, the Gutenberg-Richter b-value over the 198 events above the completeness magnitude (2.7) is 0.71 ± 0.05 — a bit below the canonical 1.0, hinting at a relatively large share of bigger events in this sequence. Five days is too early to read much into that; I’m logging it as a baseline.
A same-conditions rematch with the 2016 Kumamoto earthquake
This is what I actually wanted to measure. In April 2016, this same region produced one of Japan’s most damaging inland earthquake sequences: a M6.5 foreshock, then 28 hours later a M7.3 mainshock. Anyone who lived in Kyushu then remembers it. How does the current sequence compare, in numbers?
Comparisons need equal footing. JMA’s public feed doesn’t reach back to 2016 at small magnitudes, so I used the USGS catalog for both sequences: same bounding box, same elapsed time after the mainshock (4.23 days), same magnitude floor (M4.5+).
| 2016 Kumamoto (Mw7.0) | 2026 Uto (Mw6.8) | |
|---|---|---|
| Aftershocks M4.5+ | 37 | 9 |
| M5.0+ | 11 | 3 |
| Largest aftershock | M5.7 | M5.6 |
| Omori-Utsu p | 1.17 | 1.22 |
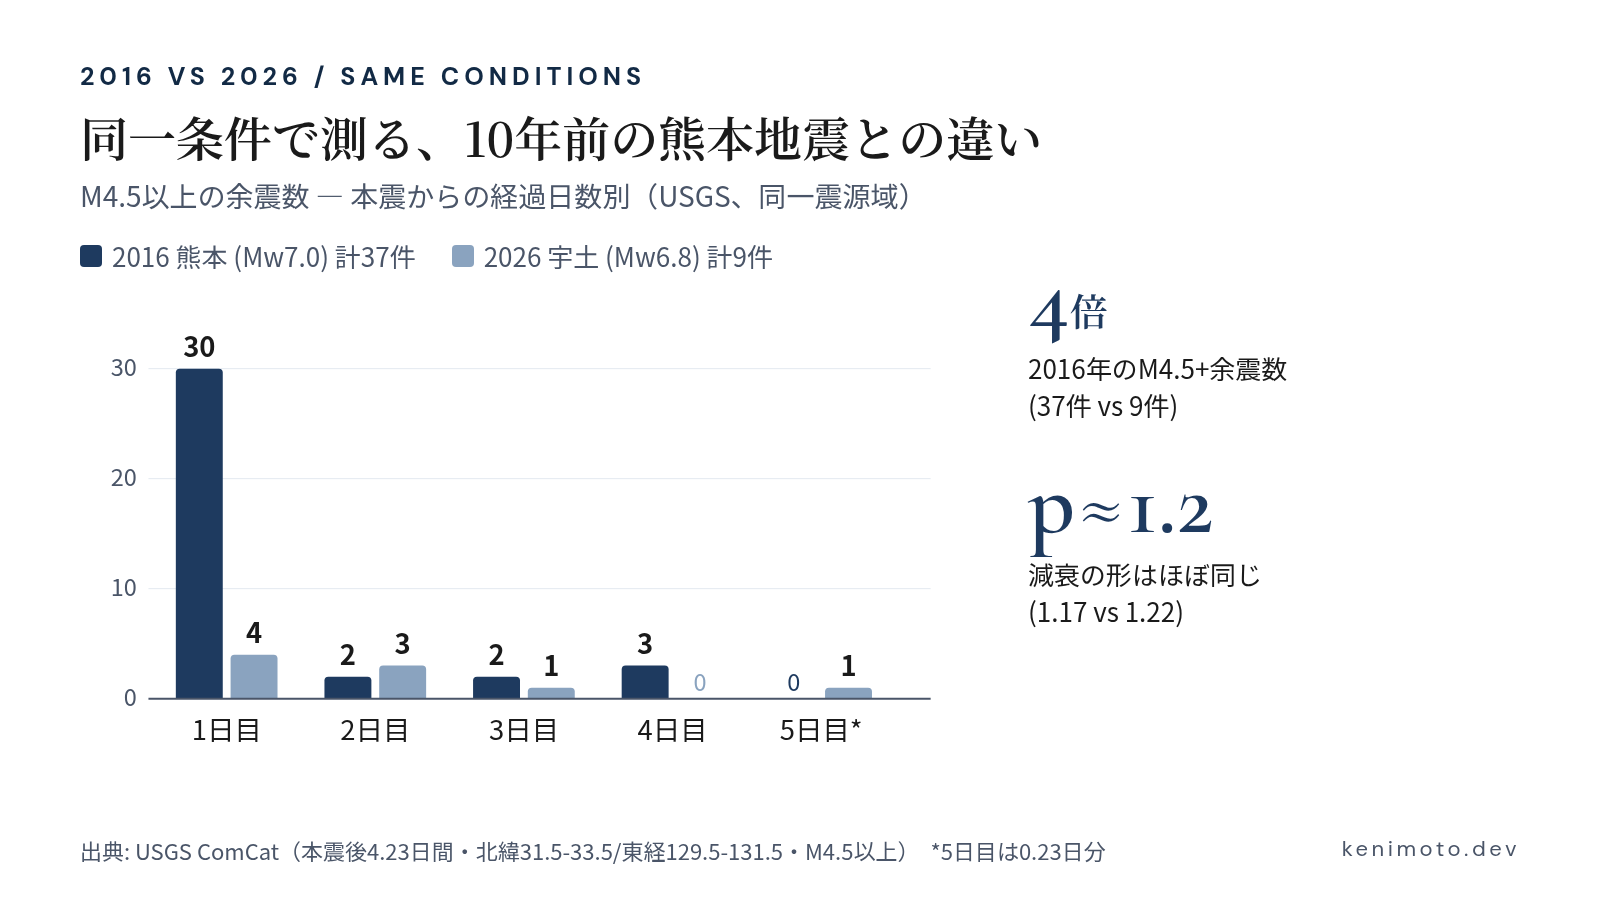
2016 was four times as intense at the same magnitude floor — more than the mainshock gap (Mw7.0 vs 6.8) alone explains, because 2016 was a cascading foreshock-mainshock sequence whose rupture zone spread toward Mt. Aso. That the current sequence stayed a single-shock event is the kind of good fortune you only notice by measuring.
Now look at the p values: 1.17 versus 1.22. Two sequences, one four times fiercer than the other, decaying in nearly the same shape. (Caveat: the 2016 fit uses the 37 M4.5+ events, the 2026 fit uses all 346 JMA events, so read the pair loosely.) The form Fusakichi Omori found in aftershock data 130 years ago shows up in both. That universality is exactly why aftershock forecasting works while prediction doesn’t.
Reproducing this
Everything here runs on quake-lens, a stdlib-only Python CLI (MIT):
git clone https://github.com/kenimo49/quake-lens.git && cd quake-lens
python3 -m quake_lens recent --limit 20
python3 -m quake_lens catalog --start 2016-04-15T16:25:07 --end 2016-04-19T22:00:00 \
  --bbox 31.5,129.5,33.5,131.5 --min-mag 4.5 --format json > k2016.json
python3 -m quake_lens omori k2016.json --mainshock 2016-04-15T16:25:06Z
Sources: JMA earthquake information, P2P Earthquake network, USGS event page.
One last thing. These are statistics as seen from 90 km away. Closer to the epicenter, people are still losing sleep to every one of those 346 entries. May the decay curve be, for them, the shape of things going quiet again.
Was this article helpful?