Static Call Graphs Miss 61% of Invocations
The code knowledge graph told me the payment change was safe. Blast radius: zero. A blast radius of zero reads like a green light. At 3am the on-call phone rang, because a reflection-based cancel path had been calling that same method for two years and nobody had drawn the edge.
A graph used as a safety net makes this failure quiet. It turned out to be a safety net with a two-year hole in it.
The 61% you can’t see
Build a call graph out of pure static analysis and you will miss a lot more than you think. The ISSTA 2024 paper on Android static analysis compared 13 popular tools against real device execution and found that, on average, 61% of dynamically executed methods were not captured by static analysis. Python looks a little better on paper: PyCG (ICSE 2021) reports 69.9% recall on its benchmark. Which sounds fine until you realize your worst incidents live in the 30% it missed.
A code knowledge graph works as the retrieval layer for an AI code reviewer. Every PR gets a query: “what depends on the symbols this diff touches?” If the graph says nothing, the reviewer says nothing. That is the failure mode. Reflection, getattr, dependency injection, event handlers — the parser sees none of them, so the graph carries a silent hole exactly where the riskiest callers live.
Rather than push the static side further up its recall curve, three more strategies go on top of it.
The six shapes of dynamic dispatch
Before picking a strategy, it helps to name what you’re chasing. Dynamic calls are not one thing:
| Pattern | Example | What static analysis sees |
|---|---|---|
| Attribute access | getattr(obj, name)(), obj[key]() | Nothing, unless name is a literal |
| Dynamic imports | importlib.import_module(name) | Only if name is a constant |
| Reflection | Java Method.invoke(), C# MethodInfo.Invoke() | Nothing |
| Dependency injection | Spring @Autowired, FastAPI Depends() | Partial, if you also read the config |
| Events and callbacks | Node.js EventEmitter, DOM events | Partial, via pattern matching |
| Metaprogramming | Python metaclasses, Ruby method_missing | Nothing |
Each row is a different hole and each hole wants its own patch. Treating them as one problem is why “just improve the static analyzer” never works.
Strategy 1: pattern matching on the literals you can see
The cheapest patch is a set of AST rules for the shapes where the target name is written in the source. This won’t help you when someone stores the method name in a variable, but it catches the low-hanging fruit.
# tree-sitter-ish pseudocode
# Matches: getattr(<x>, "<literal>")(...)
def detect_static_getattr(node):
    if node.type == "call" and node.children[0].type == "call":
        outer = node.children[0]
        if (outer.children[0].text == b"getattr"
            and outer.arguments[1].type == "string"):
            method_name = outer.arguments[1].text.decode().strip('"')
            return ("dynamic_call", method_name)
How much this recovers depends on how often the second argument is a string literal, so it is worth counting in the target repository before adopting it. That number depends entirely on how the codebase is written, so it is worth measuring rather than assuming. But the implementation cost is a weekend, so measuring is the point.
PyCG does a smarter version of this by tracking simple variable assignments (m = "save"; getattr(obj, m)). Same ceiling around 70% recall. The paper is worth reading because they are honest about where the recall stops climbing.
Strategy 2: runtime traces bolted onto the graph
Everything static will hit a ceiling around dispatch that only exists at runtime. The obvious next move is to observe runtime and feed what you see back into the graph.
Three practical sources:
sys.settraceduringpytestruns. Every function entry becomes a candidate edge.- Production log grep for
method=<name>style structured logs. Never grep the log body for arguments, only the call target. Otherwise you drag PII into the graph. coverage.pyintermediate data. It already has to hook every call to compute coverage; the byproduct is a list of “who called who” that costs you nothing extra to keep.
These go into the graph as a separate edge type, CALLS_DYNAMIC, with a confidence of 0.9–1.0. The call was actually observed, which the reviewer treats as much stronger evidence than “the parser thinks it might happen.” Confidence is what lets it phrase warnings honestly instead of uniformly.
DyPyBench (2024) is worth citing here. They built a 681K-LOC executable benchmark of 50 Python packages specifically to measure how much dynamic tracing recovers on top of static analysis. Short answer: a lot, and the gap is bigger in libraries that lean on frameworks.
The catches are real, though:
- Tests you don’t run don’t show up. If your dynamic dispatch is only exercised by an integration suite that runs weekly, you get weekly graph updates.
sys.settraceis slow. Running it in CI on every PR is painful; running it nightly onmainis fine.- Production logs are not free either. PII and cardinality concerns are real, so only the method-name column is pulled.
The practical setup is a nightly job on main that runs the full test suite under coverage.py, extracts the call pairs, and upserts them into the graph. CI stays fast; the graph stays honest.
Strategy 3: LLM inference for the shapes nothing else catches
Strategy 1 fails when the target name is a variable. Strategy 2 fails when the code path isn’t exercised. What’s left is asking a model to guess, given the surrounding code and the type of the receiver.
prompt = f"""
Given this code, list up to 3 methods likely called by
`{dynamic_call_source}`. Return a JSON array of {{method, confidence}}.

Context:
{code_snippet}

Methods available on the receiver (from the graph):
{method_list_from_kg}
"""
The key move is feeding the model the receiver’s method list from the graph. Without that, it hallucinates plausible names that don’t exist. With it, the guesses are constrained to the actual API surface and the confidence numbers become useful.
The EMSE 2025 study of LLMs for type and call graph analysis evaluated 24 models on Python and JS. Interesting split: LLMs beat traditional tools on type inference, but on call graph construction the classic static analyzers (PyCG, Jelly) still won. So don’t use the LLM as your primary call graph builder. Use it to fill holes the primary builder already flagged.
These go into the graph as CALLS_INFERRED with confidence 0.3–0.7. The AI reviewer treats them as “hint, worth reading the surrounding code” rather than “assume this call happens.”
Strategy 4: configuration files as ground truth
Dependency injection looks dynamic until you notice that the answer is written down — in a Spring @Configuration class, a FastAPI Depends() chain, a NestJS module. If the framework tells you which implementation binds to which interface, parse the framework.
# Spring-ish: read @Bean methods and link them to implementations
for cls in classes_with_annotation("@Configuration"):
    for method in cls.methods:
        if method.has_annotation("@Bean"):
            bean_type = method.return_type
            for impl in find_implementations(bean_type):
                add_edge(method, impl, type="INJECTS", confidence=0.95)
Confidence 0.95 because the config is the source of truth for a running system. The only way it’s wrong is if the runtime overrides the config, which is a bug you want the graph to help you find anyway.
When to use what
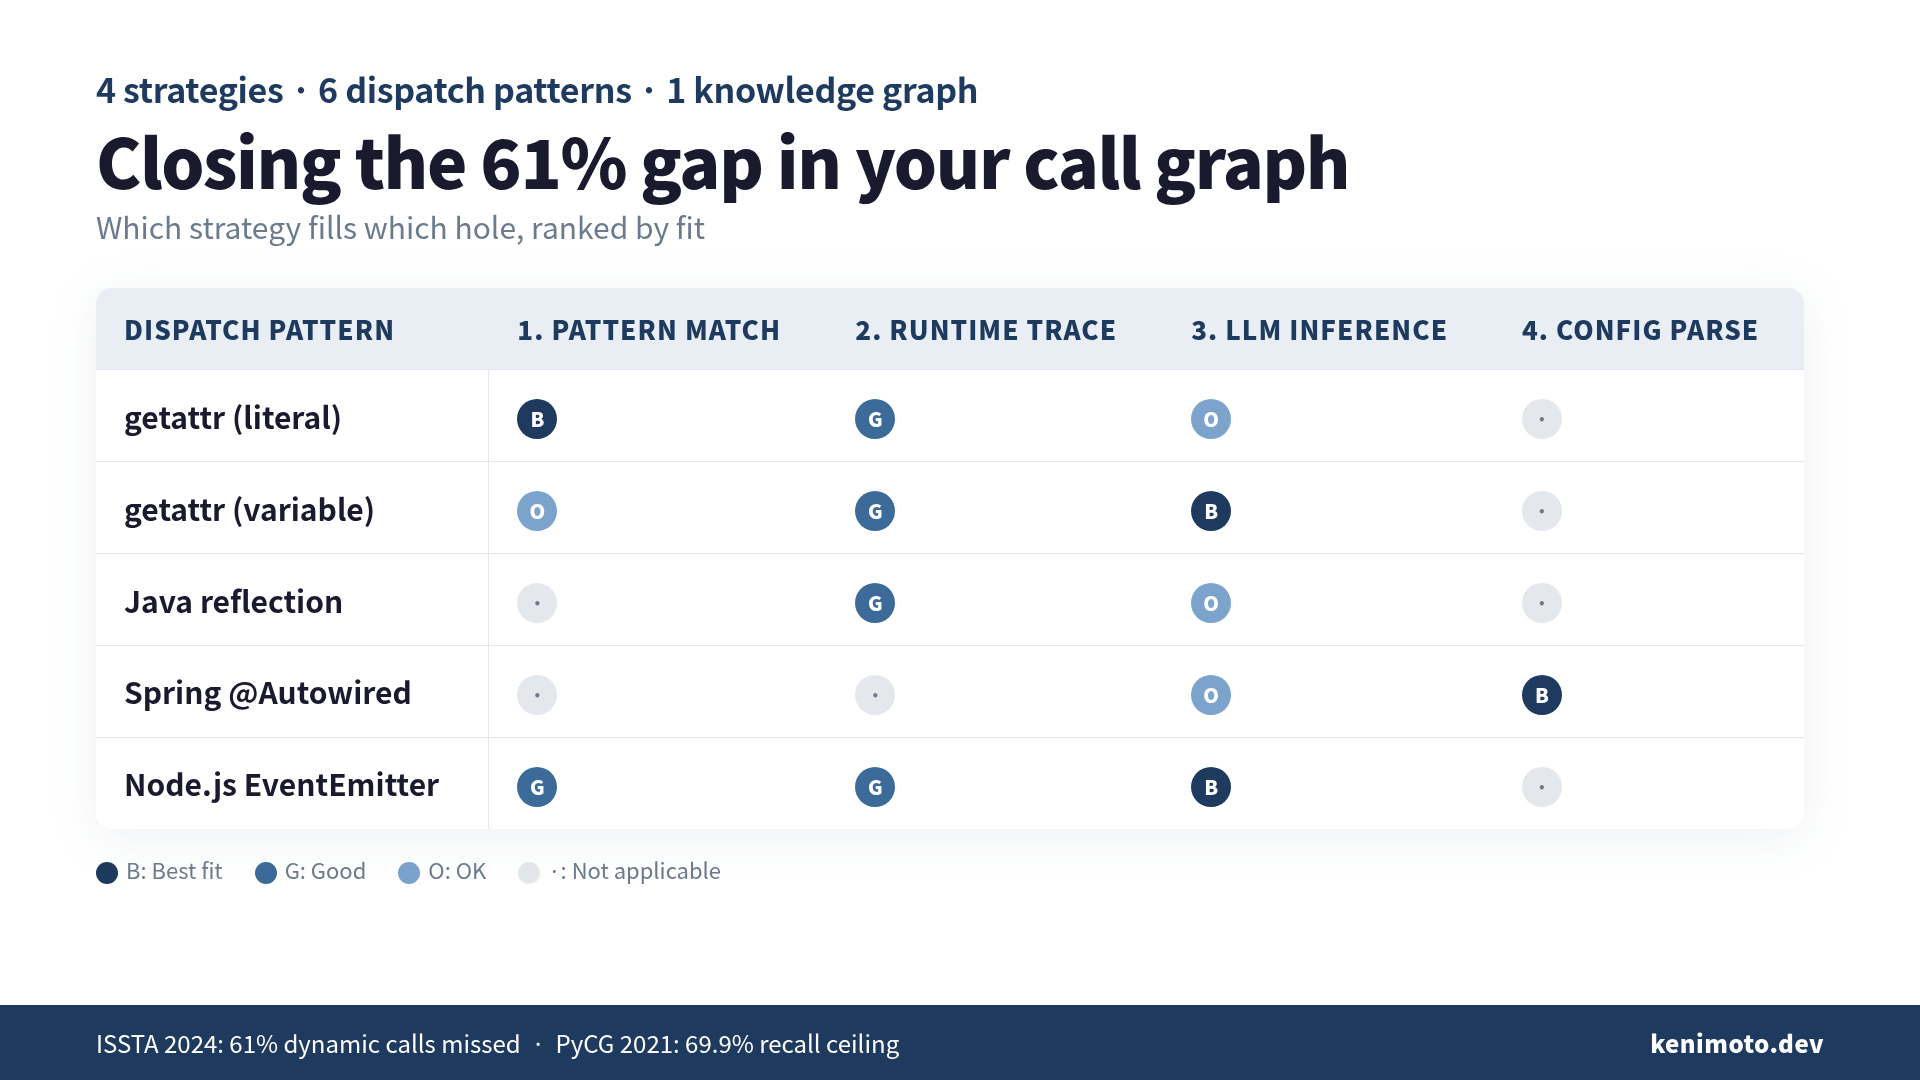
| Pattern | Strat 1 | Strat 2 | Strat 3 | Strat 4 |
|---|---|---|---|---|
getattr (literal) | Best | Good | OK | — |
getattr (variable) | Weak | Good | Best | — |
| Java reflection | — | Good | OK | — |
Spring @Autowired | — | — | OK | Best |
Node.js EventEmitter | Good | Good | Best | — |
| Python metaclasses | — | — | OK | — |
| Custom DSL | — | Weak | Best | — |
Strategy 1 is cheap, so run it everywhere. Strategy 4 is exact, so run it wherever a framework you use has a config. Strategy 2 is the strongest signal but has a CI cost, so run it nightly. Strategy 3 is the last resort for what the other three couldn’t reach.
The holes you can’t close: mark them and move on
Even with all four strategies, some dispatch remains unresolved. Java reflection alone has an entire 2017 TOSEM paper on why it resists sound analysis. That part is not solved. You will not solve it either.
What matters is what you do with the residue. Add an UNKNOWN_DYNAMIC flag on any node where dispatch is known to happen but the target could not be resolved. When the AI reviewer computes blast radius near a flagged node, it changes its output from “safe, no callers” to “static analysis cannot see past this point; here are the reflection sites within N hops.” That single change is what would have caught the 3am incident.
An unresolved edge is a wart on the graph. A silent zero is an incident report waiting to happen. The wart is worth it.
Why AI code review should care about any of this
The sales pitch for an AI code reviewer is usually “we read the diff, we tell you what’s wrong.” The 3am pitch is usually “we told you it was fine and it wasn’t.” A code knowledge graph is what turns diff-only review into blast-radius review, but only when the graph will tell the reviewer where its own eyesight ends.
Static-only graphs let the reviewer sound calm about things it never checked. Give it three vocabularies instead — CALLS_DYNAMIC at 0.9, CALLS_INFERRED at 0.3–0.7, UNKNOWN_DYNAMIC as a bare flag — and the reviewer’s output finally maps to three different levels of certainty. The engineer reading the report can weigh them.
The fix for “blast radius = 0” false positives is less clever than it looks. Better math on the static side did nothing. A graph that would admit, in writing, when it was blind is what stopped the false comfort.
Wrap-up
Static call graphs miss around 61% of dynamic calls on Android (ISSTA 2024) and about 30% on Python (PyCG). That number is not a single problem: it’s six different shapes of dynamic dispatch, and each closes with a different technique. Runtime traces via sys.settrace or coverage.py are the strongest single signal you can add, but they cost enough to belong in a nightly job on main rather than in CI. LLM inference is worth running only after the primary builder has flagged the holes, and only when you feed it the receiver’s method list so it stops hallucinating names.
The one thing not to skip is the UNKNOWN_DYNAMIC flag. Whatever you can’t resolve, tag it, and let the reviewer downgrade its own confidence in front of the human. The graph that hurts you is the one that never spoke up.
If you’re building the knowledge graph side of this stack, I wrote a longer piece on The Practical Knowledge Graph Guide — GraphRAG, Neo4j, and property graphs with working code rather than diagrams.
 Related book The Practical Knowledge Graph Guide Why RAG alone won't make your AI smart — GraphRAG, Neo4j, and Property Graphs explained with working code, not abstractions View the book page →
 Was this article helpful?