GEO's +115% From Statistics Is Domain-Dependent: It Worked for My Tech Posts and Did Nothing for My How-To Pages
For about two weeks last spring I was the most insufferable version of myself: the guy who read one paper and decided it explained everything. The paper was the Princeton GEO study, the number was +115.1%, and the takeaway I walked away with was “add statistics to your content and AI engines cite you twice as often.” So I did the obvious thing. I opened every page on my site and started stuffing numbers into it like a parent hiding vegetables in a kid’s dinner. Pricing comparisons got percentages. My how-to guides got survey data. I even added a stat to my About page, which in hindsight is the kind of decision you make at 1 a.m. and regret in daylight.
Three weeks later I checked which pages had actually started showing up in AI answers. The tech posts had climbed. The how-to pages had not moved a millimeter. Same treatment, same effort, completely different outcome. That gap is the whole point of this post, and it’s the part the headline number quietly hides.
Where the +115.1% actually comes from
Quick grounding, because this number gets repeated a lot by people who never read past the abstract. It comes from GEO: Generative Engine Optimization, a 2024 paper out of Princeton that built a 10,000-query benchmark called GEO-bench and tested nine ways of rewriting content to get cited more in generative engines like Perplexity and AI Overviews. Of the nine methods, adding statistics came out on top at +115.1% visibility. Adding citations landed at +77.8%. Using technical terms at +47.3%. The crowd favorites of old-school SEO, keyword density and general “readability” polish, barely registered.
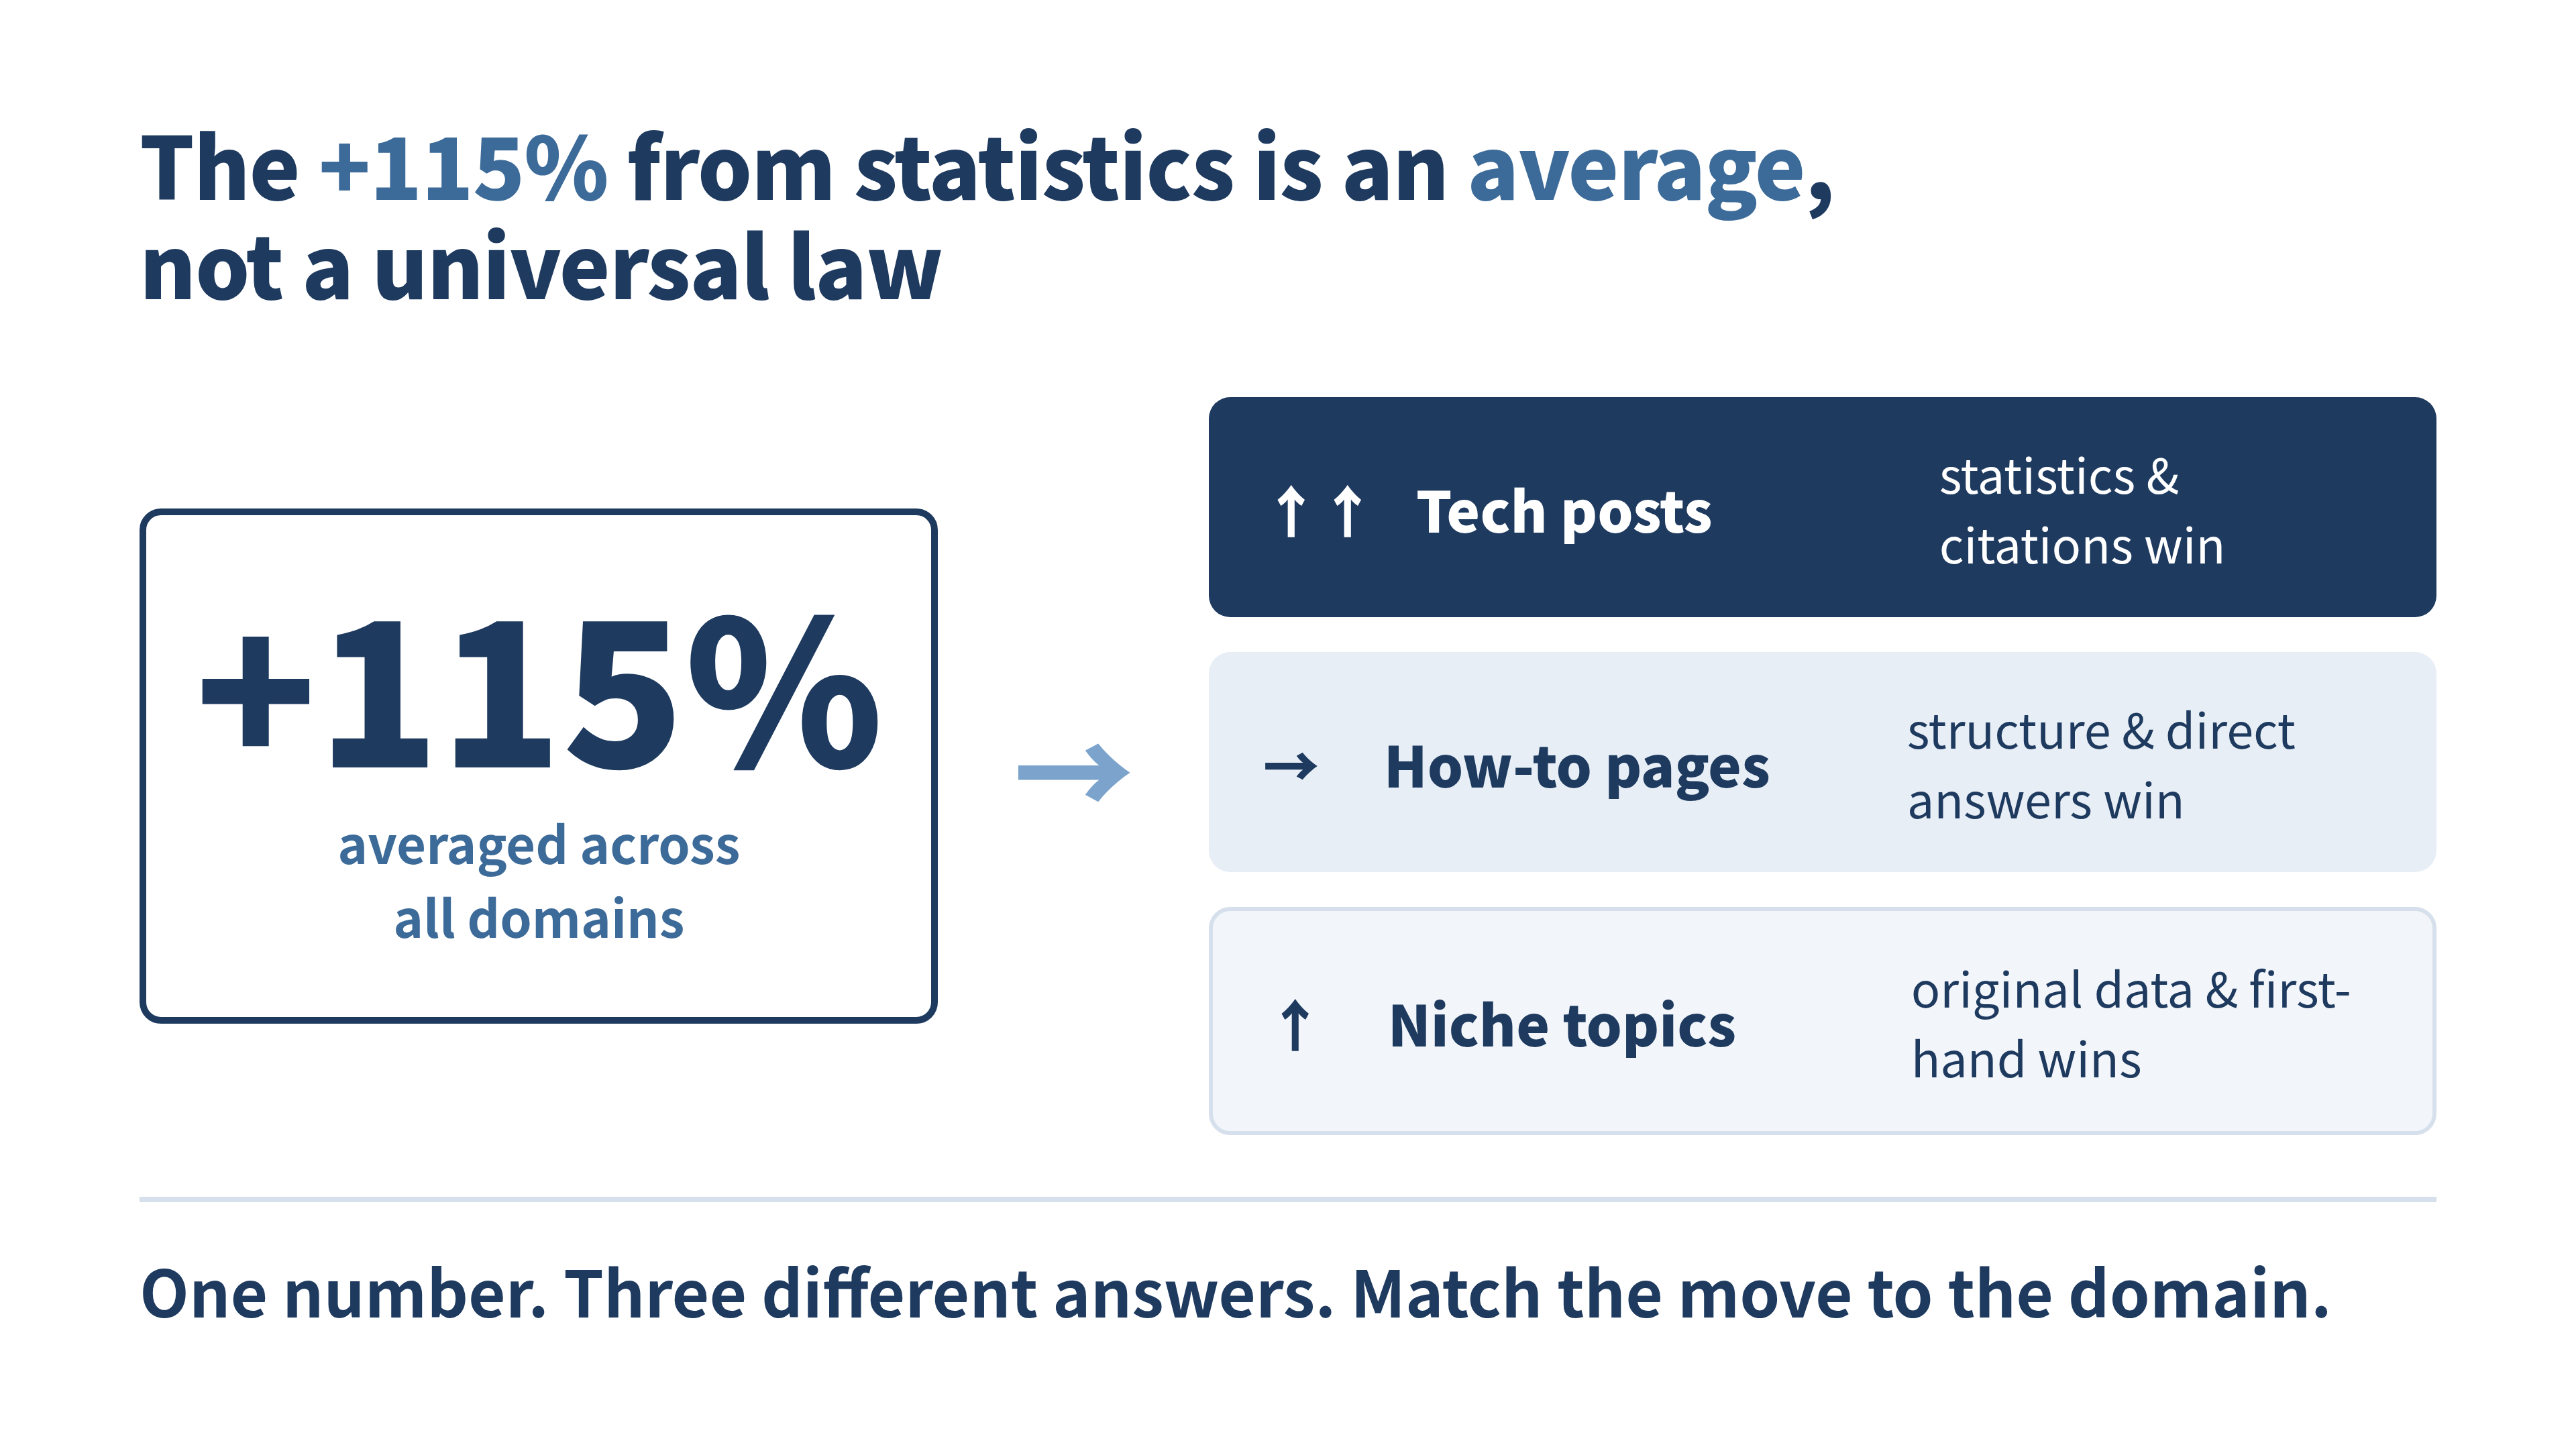
So far so good. The trap is in one word: average. The +115.1% is the effect measured across the entire benchmark, and that benchmark deliberately spans science, technical topics, general knowledge, and niche subjects. A single average over four very different populations tells you what happened on average and almost nothing about what will happen on your specific page. The paper’s authors knew this, which is why they also reported the breakdown by domain. That breakdown is the part nobody screenshots.
The breakdown the headline skips
When you split the results by content type, the story stops being “add statistics” and becomes “add the right thing for your domain.” Roughly, it shakes out like this:
- Science and technical content rewards statistics and authoritative citations most heavily. This is where the +115% effect actually lives. When a model answers a technical question, it is hunting for backing data, and a passage with a concrete number reads as “safe to quote.”
- General topics reward clear structure and a direct answer to the question far more than raw numbers. A statistic dropped into a general how-to doesn’t make the passage more quotable; a clean “here is the answer in the first sentence” does.
- Niche topics reward original data and first-hand experience, because the information is scarce to begin with and the model has fewer sources to triangulate against.
Look at that list and my little experiment stops being mysterious. My tech posts sat squarely in the first bucket, so the numbers I added gave the model exactly the signal it wanted. My how-to pages sat in the second bucket, where a sentence like “32.2% of teams report X” does nothing to make “how do I rotate my API keys” easier to answer. I had applied a science-and-tech remedy to a general-knowledge patient and then acted surprised when it didn’t take.
2026 keeps confirming it, with smaller numbers
Here’s the honest update, because that 2024 paper is now old enough that treating it as gospel is its own mistake. Replications through 2026 have generally found the statistics effect to be real but smaller than the original benchmark figure, often landing closer to a +32% visibility lift from statistics in more recent measurements, with quotations and citations clustering in a similar range. The direction holds. The magnitude shrinks once you leave the lab and enter a web where everyone else is also optimizing.
Two other 2026 findings matter more for how you should read all of this. First, the overlap between the top Google results and the sources AI engines actually cite has dropped from around 70% to under 20%, which means your old SEO ranking is a worse and worse predictor of whether you get quoted. Second, the citation-source overlap between ChatGPT and Perplexity sits around 11%, so “I got cited” on one engine barely predicts the same on another. Stack those two facts on top of the domain split and the uncomfortable conclusion is that there is no single lever. There are domains, engines, and query types, and the right move changes across all three.
If you want the domain-by-domain version of this worked out into an actual decision framework, llmoframework.com lays out how to read GEO results per industry and where the optimization budget should go depending on whether you publish technical, commercial, or general content. That’s the reference I wish I’d had before my vegetable-hiding phase, because it would have stopped me at the About page.
What I do now instead of stuffing numbers everywhere
The replacement habit is boring and it works. Before optimizing a page, I ask which bucket it falls into, and I treat that as the instruction.
For technical and data-heavy posts, I lead with a concrete number and back it with a real source, because that’s the bucket where the +115% lived in the first place. For how-to and general pages, I stop forcing statistics and instead make the first sentence under each heading answer the question directly, since structure and directness are what that bucket rewards. For the niche stuff where I’m one of three people writing about a topic, I lean on my own measurements and screenshots, because original data is the scarce thing a model can’t get elsewhere.
There’s also a structural point that survives across all three buckets, and it’s worth saying plainly: models quote passages, not pages. A 2026 line of work on diagnosing and repairing citation failures keeps landing on the same place, which is that whether a specific paragraph is self-contained and well-formed matters more than any sitewide tactic. So the domain question and the passage question stack. Pick the right optimization for the domain, then make sure each paragraph can stand on its own when an engine lifts it out of context.
One last note to keep this honest, since I got burned by exactly this energy. None of these numbers are laws. They’re measurements taken at a moment, on specific engines, that drift as the models change underneath us. The thing that doesn’t drift is the underlying logic: a model reaches for whatever makes an answer feel safe to give, and what feels safe depends on what’s being asked. Statistics feel safe for a benchmark question. A clean direct answer feels safe for a how-to. Read the question, then optimize.
So no, I’m not anti-statistics. I added a number to this very post and meant it. I just stopped treating one averaged figure as a universal law, took the stat back off my About page, and started asking what each page was actually for. Turns out that’s the optimization. The numbers were never the point; matching the move to the domain was.
If you want the full version of this argument, with the GEO paper’s methodology, the per-platform citation differences, and a domain-by-domain playbook worked out end to end, I wrote a book about exactly this: Why ChatGPT Ignores Your Website.
Was this article helpful?